
Page 183 - Subyek Teknik Mesin - Forsthoffers Best Practice Handbook for Rotating Machinery by William E Forsthoffer
P. 183
Compressor Best Practices Best Practice 3 .13
stage will increase the volume flow in a succeeding stage and
reduce the overall head produced by a compressor section.
Discharge temperature
Process gas characteristics Figure 3.13.18 shows the effect of changing the molecular
Casing configuration weight in the same compressor. Note that for molecular weight
Rotor stiffness changes of less than 20%, the head produced by a dynamic
compressor stage does not change significantly. The greater the
density of a gas, the greater the discharge pressure and the closer
Fig 3.13.15 The number of stages per section e limiting factors
the surge point to the design point.
Some processes can cause accumulation of solid materials This is because once any dynamic compressor stage is
(fouling) within the compressor impellers or stationary passages. designed, the head (energy) produced for a given flow and speed
Such a phenomenon is usually temperature related, and can is fixed. The greater the density of the gas (proportional to
influence the number of intercooled sections for a given appli- molecular weight), the higher the pressure produced and the
cation. Also, a large number of stages on a single rotor can reduce lower the volume flow. Flow is inversely proportional to pres-
the rotor stiffness and thus reduce the natural frequency (crit- sure (Boyle’s Law). Since surge is caused by low flow, a dynamic
ical speed) of the compressor. compressor handling a denser gas will surge sooner.
In the case of reduced gas density, the opposite effect will
Determining section performance occur. The discharge pressure will be reduced and the surge
point will move to the left, farther from the design point.
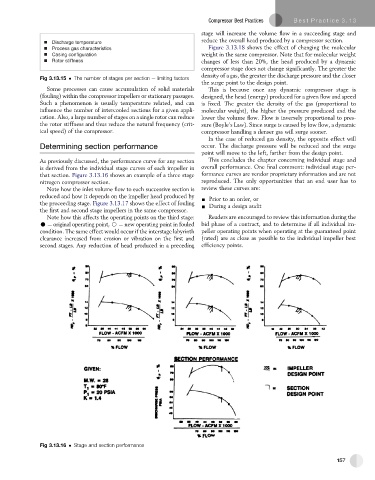
As previously discussed, the performance curve for any section This concludes the chapter concerning individual stage and
is derived from the individual stage curves of each impeller in overall performance. One final comment: individual stage per-
that section. Figure 3.13.16 shows an example of a three stage formance curves are vendor proprietary information and are not
nitrogen compressor section. reproduced. The only opportunities that an end user has to
Note how the inlet volume flow to each successive section is review these curves are:
reduced and how it depends on the impeller head produced by - Prior to an order, or
the proceeding stage. Figure 3.13.17 shows the effect of fouling
- During a design audit
the first and second stage impellers in the same compressor.
Note how this affects the operating points on the third stage: Readers are encouraged to review this information during the
C ¼ original operating point, B ¼ new operating point in fouled bid phase of a contract, and to determine if all individual im-
condition. The same effect would occur if the interstage labyrinth peller operating points when operating at the guaranteed point
clearance increased from erosion or vibration on the first and (rated) are as close as possible to the individual impeller best
second stages. Any reduction of head produced in a preceding efficiency points.
Fig 3.13.16 Stage and section performance
157