
Page 199 - Subyek Teknik Mesin - Forsthoffers Best Practice Handbook for Rotating Machinery by William E Forsthoffer
P. 199
Compressor Best Practices Best Practice 3 .18
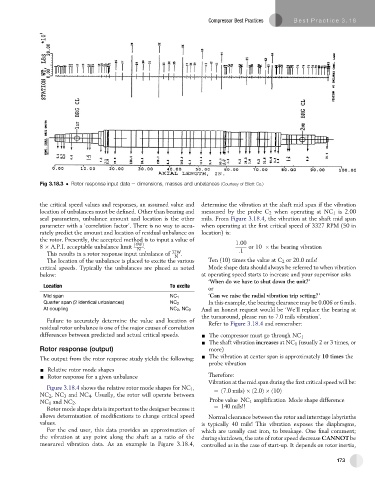
Fig 3.18.3 Rotor response input data e dimensions, masses and unbalances (Courtesy of Elliott Co.)
the critical speed values and responses, an assumed value and determine the vibration at the shaft mid span if the vibration
location of unbalances must be defined. Other than bearing and measured by the probe C 2 when operating at NC 1 is 2.00
seal parameters, unbalance amount and location is the other mils. From Figure 3.18.4, the vibration at the shaft mid span
parameter with a ‘correlation factor’. There is no way to accu- when operating at the first critical speed of 3327 RPM (50 in
rately predict the amount and location of residual unbalance on location) is:
the rotor. Presently, the accepted method is to input a value of 1:00
8 A.P.I. acceptable unbalance limit ð4WÞ . or 10 the bearing vibration
N
This results in a rotor response input unbalance of 32W . :1
N
The location of the unbalance is placed to excite the various Ten (10) times the value at C 2 or 20.0 mils!
critical speeds. Typically the unbalances are placed as noted Mode shape data should always be referred to when vibration
below: at operating speed starts to increase and your supervisor asks
‘When do we have to shut down the unit?’
Location To excite
or
Mid span NC 1 ‘Can we raise the radial vibration trip setting?’
Quarter span (2 identical unbalances) NC 2 In this example, the bearing clearance may be 0.006 or 6 mils.
At coupling NC 2 ,NC 3 And an honest request would be ‘We’ll replace the bearing at
the turnaround, please run to 7.0 mils vibration’.
Failure to accurately determine the value and location of Refer to Figure 3.18.4 and remember:
residual rotor unbalance is one of the major causes of correlation
differences between predicted and actual critical speeds. - The compressor must go through NC 1
- The shaft vibration increases at NC 1 (usually 2 or 3 times, or
Rotor response (output) more)
The output from the rotor response study yields the following: - The vibration at center span is approximately 10 times the
probe vibration
- Relative rotor mode shapes
- Rotor response for a given unbalance Therefore:
Vibration at the mid span during the first critical speed will be:
Figure 3.18.4 shows the relative rotor mode shapes for NC 1 ,
¼ð7:0 milsÞ ð2:0Þ ð10Þ
NC 2 ,NC 3 and NC 4 . Usually, the rotor will operate between
NC 1 and NC 2 . Probe value NC 1 amplification Mode shape difference
Rotor mode shape data is important to the designer because it ¼ 140 mils!!
allows determination of modifications to change critical speed Normal clearance between the rotor and interstage labyrinths
values. is typically 40 mils! This vibration exposes the diaphragms,
For the end user, this data provides an approximation of which are usually cast iron, to breakage. One final comment;
the vibration at any point along the shaft as a ratio of the during shutdown, the rate of rotor speed decrease CANNOT be
measured vibration data. As an example in Figure 3.18.4, controlled as in the case of start-up. It depends on rotor inertia,
173