
Page 201 - Subyek Teknik Mesin - Forsthoffers Best Practice Handbook for Rotating Machinery by William E Forsthoffer
P. 201
Compressor Best Practices Best Practice 3 .18
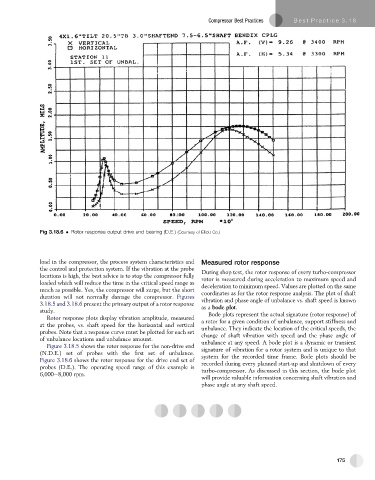
Fig 3.18.6 Rotor response output drive end bearing (D.E.) (Courtesy of Elliott Co.)
load in the compressor, the process system characteristics and Measured rotor response
the control and protection system. If the vibration at the probe During shop test, the rotor response of every turbo-compressor
locations is high, the best advice is to stop the compressor fully rotor is measured during acceleration to maximum speed and
loaded which will reduce the time in the critical speed range as deceleration to minimum speed. Values are plotted on the same
much as possible. Yes, the compressor will surge, but the short
coordinates as for the rotor response analysis. The plot of shaft
duration will not normally damage the compressor. Figures vibration and phase angle of unbalance vs. shaft speed is known
3.18.5 and 3.18.6 present the primary output of a rotor response
as a bode plot.
study. Bode plots represent the actual signature (rotor response) of
Rotor response plots display vibration amplitude, measured
at the probes, vs. shaft speed for the horizontal and vertical a rotor for a given condition of unbalance, support stiffness and
unbalance. They indicate the location of the critical speeds, the
probes. Note that a response curve must be plotted for each set change of shaft vibration with speed and the phase angle of
of unbalance locations and unbalance amount. unbalance at any speed. A bode plot is a dynamic or transient
Figure 3.18.5 shows the rotor response for the non-drive end signature of vibration for a rotor system and is unique to that
(N.D.E.) set of probes with the first set of unbalance. system for the recorded time frame. Bode plots should be
Figure 3.18.6 shows the rotor response for the drive end set of recorded during every planned start-up and shutdown of every
probes (D.E.). The operating speed range of this example is turbo-compressor. As discussed in this section, the bode plot
6,000 8,000 rpm.
will provide valuable information concerning shaft vibration and
phase angle at any shaft speed.
175