
Page 298 - Subyek Teknik Mesin - Forsthoffers Best Practice Handbook for Rotating Machinery by William E Forsthoffer
P. 298
Steam Turbine Best Practices Be st Practice 5.5
Ten (10) times the value at C 2 or 20.0 mils!
Mode shape data should always be referred to when vibration
at operating speed starts to increase and your supervisor asks
‘When do we have to shutdown the unit?’
or
‘Can we raise the radial vibration trip setting?’
In this example, the bearing clearance may be 0.006 or 6 mils,
and an honest request would be ‘We’ll replace the bearing at the
turnaround, please run to 7.0 mils vibration’.
Refer to Figure 5.5.5 and remember:
- The compressor must go through NC 1
- The shaft vibration increases at NC 1 (usually 2 ,3 or
more)
- The vibration at center span is approximately 103 the probe
vibration
Therefore:
Vibration at the mid span during the first critical speed will
be:
¼ð7:0 milsÞ ð2:0Þ ð10Þ
Probe value NC 1 amplification Mode shape difference
¼ 140 mils!!
Normal clearance between the rotor and interstage labyrinths
is typically 40 mil! This vibration exposes the diaphragms, which
are usually cast iron, to breakage. One final comment; during
shutdown, the rate of rotor speed decrease CANNOT be
controlled as in the case of start-up. It depends on rotor inertia,
load in the compressor, the process system characteristics and
the control and protection system. If the vibration at the probe
locations is high, the best advice is to stop the compressor while
fully loaded, which will reduce the time in the critical speed
range as much as possible. Yes, the compressor will surge, but
the short duration will not normally damage it. Figures 5.5.6 and
5.5.7 present the primary output of a rotor response study.
Rotor response plots display vibration amplitude, measured
at the probes, vs. shaft speed for the horizontal and vertical
probes. Note that a response curve must be plotted for each set
of unbalance locations and unbalance amount.
Figure 5.5.6 shows the rotor response for the non-drive end
(NDE) set of probes with the first set of unbalance.
Figure 5.5.7 shows the rotor response for the drive end set of
probes (DE). The operating speed range of this example is
6,000 8,000 rpm.
Measured rotor response
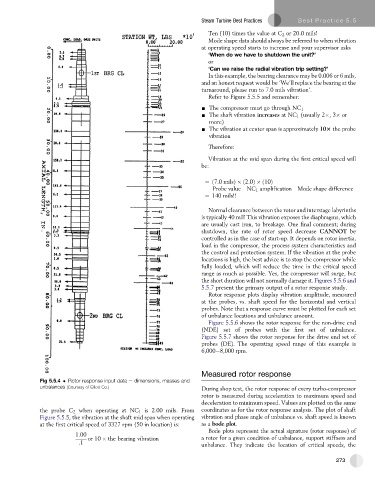
Fig 5.5.4 Rotor response input data e dimensions, masses and
unbalances (Courtesy of Elliott Co.) During shop test, the rotor response of every turbo-compressor
rotor is measured during acceleration to maximum speed and
deceleration to minimum speed. Values are plotted on the same
the probe C 2 when operating at NC 1 is 2.00 mils. From coordinates as for the rotor response analysis. The plot of shaft
Figure 5.5.5, the vibration at the shaft mid span when operating vibration and phase angle of unbalance vs. shaft speed is known
at the first critical speed of 3327 rpm (50 in location) is: as a bode plot.
Bode plots represent the actual signature (rotor response) of
1:00
or 10 the bearing vibration a rotor for a given condition of unbalance, support stiffness and
:1
unbalance. They indicate the location of critical speeds, the
273