
Page 297 - Subyek Teknik Mesin - Forsthoffers Best Practice Handbook for Rotating Machinery by William E Forsthoffer
P. 297
Be st Practice 5 .5 Steam Turbine Best Practices
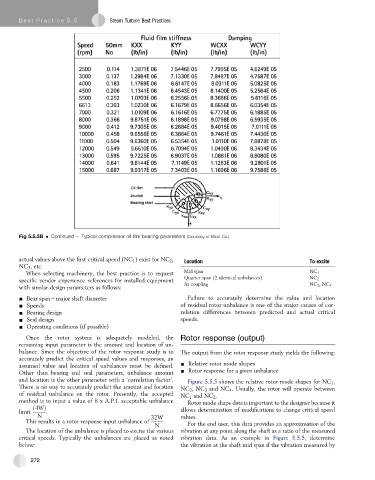
Fig 5.5.3B Continued e Typical compressor oil film bearing parameters (Courtesy of Elliott Co.)
actual values above the first critical speed (NC 1 ) exist for NC 2 , Location To excite
NC 3 , etc.
When selecting machinery, the best practice is to request Mid span NC 1
specific vendor experience references for installed equipment Quarter span (2 identical unbalances) NC 2
with similar design parameters as follows: At coupling NC 2 ,NC 3
- Bear spanOmajor shaft diameter Failure to accurately determine the value and location
- Speeds of residual rotor unbalance is one of the major causes of cor-
- Bearing design relation differences between predicted and actual critical
- Seal design speeds.
- Operating conditions (if possible)
Once the rotor system is adequately modeled, the Rotor response (output)
remaining input parameter is the amount and location of un-
balance. Since the objective of the rotor response study is to The output from the rotor response study yields the following:
accurately predict the critical speed values and responses, an
assumed value and location of unbalances must be defined. - Relative rotor mode shapes
Other than bearing and seal parameters, unbalance amount - Rotor response for a given unbalance
and location is the other parameter with a ‘correlation factor’. Figure 5.5.5 shows the relative rotor mode shapes for NC 1 ,
There is no way to accurately predict the amount and location NC 2 ,NC 3 and NC 4 . Usually, the rotor will operate between
of residual unbalance on the rotor. Presently, the accepted NC 1 and NC 2 .
method is to input a value of 8 x A.P.I. acceptable unbalance Rotor mode shape data is important to the designer because it
ð4WÞ allows determination of modifications to change critical speed
limit .
N 32W values.
This results in a rotor response input unbalance of .
N For the end user, this data provides an approximation of the
The location of the unbalance is placed to excite the various vibration at any point along the shaft as a ratio of the measured
critical speeds. Typically the unbalances are placed as noted vibration data. As an example in Figure 5.5.5, determine
below: the vibration at the shaft mid span if the vibration measured by
272