
Page 127 - Fundamentals of Light Microscopy and Electronic Imaging
P. 127
110 PHASE CONTRAST MICROSCOPY AND DARK-FIELD MICROSCOPY
image of a large phase object of constant optical path length across its diameter would
appear uniformly dark or light, but this is not the case. As shown schematically in Fig-
ure 7-11, the intensity profile of a phase-dark object gradually increases toward the cen-
ter of the object. If the object is large enough, the light intensity in the central regions
approaches that of the surrounding background. Shade-off is frequently observed on
large, extended objects such as extended or flattened cells (Fig. 7-1), flattened nuclei,
and planar slabs of materials, for example, mica or glass. The phenomenon is also
known as the zone-of-action effect, because central uniform zones and refractile edge
zones of an object diffract light differently. In central regions of an object, the amount
of diffraction and the angle of scattering are greatly reduced. Object rays, although
retarded in phase, deviate only slightly from the 0th-order component, and fall within
the annulus of the phase plate. As a result, the amplitude and intensity of the central
region are essentially the same as the background. The presence of shade-off in
extended objects and the high image contrast at edges remind us that the phase contrast
mechanism is principally one of diffraction and scattering.
(a) (c)
I
χ
(b) (d)
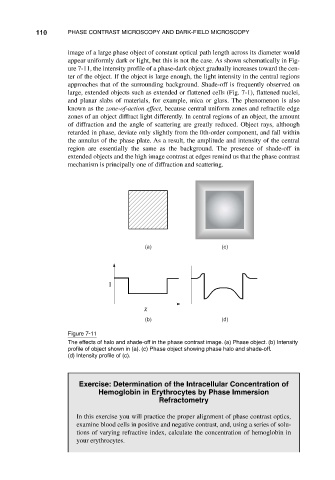
Figure 7-11
The effects of halo and shade-off in the phase contrast image. (a) Phase object. (b) Intensity
profile of object shown in (a). (c) Phase object showing phase halo and shade-off.
(d) Intensity profile of (c).
Exercise: Determination of the Intracellular Concentration of
Hemoglobin in Erythrocytes by Phase Immersion
Refractometry
In this exercise you will practice the proper alignment of phase contrast optics,
examine blood cells in positive and negative contrast, and, using a series of solu-
tions of varying refractive index, calculate the concentration of hemoglobin in
your erythrocytes.