Page 256 - Fundamentals of Light Microscopy and Electronic Imaging
P. 256

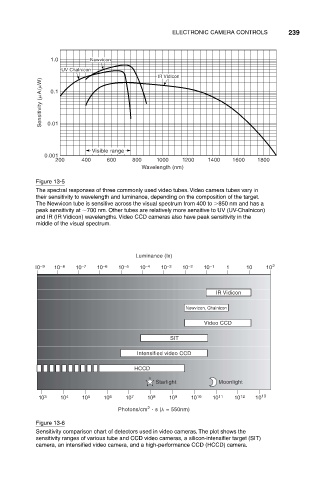
ELECTRONIC CAMERA CONTROLS        239


                           1.0         Newvicon
                              UV Chalnicon
                                                           IR Vidicon
                        Sensitivity ( A/ W)  0.01
                           0.1


                                       Visible range
                         0.001
                            200     400     600     800    1000    1200   1400    1600   1800
                                                      Wavelength (nm)
                       Figure 13-5
                       The spectral responses of three commonly used video tubes. Video camera tubes vary in
                       their sensitivity to wavelength and luminance, depending on the composition of the target.
                       The Newvicon tube is sensitive across the visual spectrum from 400 to  850 nm and has a
                       peak sensitivity at  700 nm. Other tubes are relatively more sensitive to UV (UV-Chalnicon)
                       and IR (IR Vidicon) wavelengths. Video CCD cameras also have peak sensitivity in the
                       middle of the visual spectrum.


                                                     Luminance (lx)
                      10 –9  10 –8  10 –7  10 –6  10 –5  10 –4  10 –3  10 –2  10 –1  1  10  10 2


                                                                             IR Vidicon

                                                                    Newvicon, Chalnicon

                                                                         Video CCD

                                                               SIT

                                                     Intensified video CCD

                                                    HCCD
                                                           Starlight         Moonlight

                       10 3   10  4  10 5  10 6   10  7  10 8  10 9  10 10  10 11  10 12  10 13
                                                        2
                                               Photons/cm · s (  = 550nm)
                       Figure 13-6
                       Sensitivity comparison chart of detectors used in video cameras. The plot shows the
                       sensitivity ranges of various tube and CCD video cameras, a silicon-intensifier target (SIT)
                       camera, an intensified video camera, and a high-performance CCD (HCCD) camera.
   251   252   253   254   255   256   257   258   259   260   261