
Page 151 - Fundamentals of Water Treatment Unit Processes : Physical, Chemical, and Biological
P. 151
106 Fundamentals of Water Treatment Unit Processes: Physical, Chemical, and Biological
6.5 FLOCCULENT SUSPENSIONS (TYPE II)
TABLE 6.3
Flocculation occurs when particles collide and attach to each Results of Settling Column Test for Type II Suspension
other thus increasing in size. As such, particles collide during
Suspended Solids Concentration (mg=L)
settling and grow in size as they settle at an increasingly
higher rate, i.e., proportional to the diameter squared, per Liquid Depth Time (min)
Stokes’ law, Equation 6.6. (m) (ft) 0 10 30 50 80 110 140 170
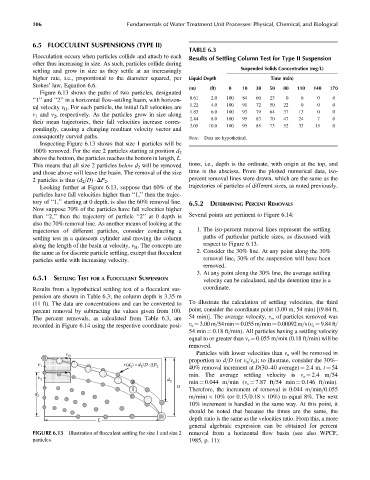
Figure 6.13 shows the paths of two particles, designated
0.61 2.0 100 84 60 23 0 0 0 0
‘‘1’’ and ‘‘2’’ in a horizontal flow-settling basin, with horizon-
1.22 4.0 100 91 72 50 22 0 0 0
tal velocity v H . For each particle, the initial fall velocities are
1.83 6.0 100 93 79 64 37 13 0 0
v 1 and v 2 , respectively. As the particles grow in size along
2.44 8.0 100 95 83 70 47 24 7 0
their mean trajectories, their fall velocities increase corres-
3.05 10.0 100 95 85 73 52 33 15 0
pondingly, causing a changing resultant velocity vector and
consequently curved paths. Note: Data are hypothetical.
Inspecting Figure 6.13 shows that size 1 particles will be
100% removed. For the size 2 particles starting at position d 2
above the bottom, the particles reaches the bottom in length, L.
This means that all size 2 particles below d 2 will be removed tions, i.e., depth is the ordinate, with origin at the top, and
and those above will leave the basin. The removal of the size time is the abscissa. From the plotted numerical data, iso-
2 particles is thus (d 2 =D) DP 2 . percent removal lines were drawn, which are the same as the
Looking further at Figure 6.13, suppose that 60% of the trajectories of particles of different sizes, as noted previously.
particles have fall velocities higher than ‘‘1,’’ then the trajec-
tory of ‘‘1,’’ starting at 0 depth, is also the 60% removal line. 6.5.2 DETERMINING PERCENT REMOVALS
Now suppose 70% of the particles have fall velocities higher
than ‘‘2,’’ then the trajectory of particle ‘‘2’’ at 0 depth is Several points are pertinent to Figure 6.14:
also the 70% removal line. As another means of looking at the
trajectories of different particles, consider conducting a 1. The iso-percent removal lines represent the settling
settling test in a quiescent cylinder and moving the column paths of particular particle sizes, as discussed with
along the length of the basin at velocity, v H . The concepts are respect to Figure 6.13.
the same as for discrete particle settling, except that flocculent 2. Consider the 30% line. At any point along the 30%
particles settle with increasing velocity. removal line, 30% of the suspension will have been
removed.
3. At any point along the 30% line, the average settling
6.5.1 SETTLING TEST FOR A FLOCCULENT SUSPENSION
velocity can be calculated, and the detention time is a
Results from a hypothetical settling test of a flocculent sus- coordinate.
pension are shown in Table 6.3; the column depth is 3.35 m
(11 ft). The data are concentrations and can be converted to To illustrate the calculation of settling velocities, the third
percent removal by subtracting the values given from 100. point, consider the coordinate point (3.00 m, 54 min) [(9.84 ft,
The percent removals, as calculated from Table 6.3, are 54 min)]. The average velocity, v s , of particles removed was
recorded in Figure 6.14 using the respective coordinate posi- v s ¼ 3.00 m=54 min ¼ 0.055 m=min ¼ 0.00092 m=s(v s ¼ 9.84 ft=
54 min ¼ 0.18 ft=min). All particles having a settling velocity
equal to or greater than v s ¼ 0.055 m=min (0.18 ft=min) will be
removed.
v H Particles with lower velocities than v s will be removed in
proportion to d=D (or v s =v o ); to illustrate, consider the 30%–
v 1 r(d )= d /D ΔP 2 40% removal increment at D(30–40 average) ¼ 2.4 m, t ¼ 54
2
2
min. The average settling velocity is v s ¼ 2.4 m=54
v 2 d
2 2 min ¼ 0.044 m=min (v s ¼ 7.87 ft=54 min ¼ 0.146 ft=min).
D
1 Therefore, the increment of removal is 0.044 m=min=0.055
d 2
m=min) 10% (or 0.15=0.18 10%) to equal 8%. The next
10% increment is handled in the same way. At this point, it
should be noted that because the times are the same, the
L depth ratio is the same as the velocities ratio. From this, a more
general algebraic expression can be obtained for percent
FIGURE 6.13 Illustration of flocculent settling for size 1 and size 2 removal from a horizontal flow basin (see also WPCF,
particles. 1985, p. 11):