
Page 153 - Fundamentals of Water Treatment Unit Processes : Physical, Chemical, and Biological
P. 153
108 Fundamentals of Water Treatment Unit Processes: Physical, Chemical, and Biological
6.6.1 SETTLING VELOCITY AS AFFECTED BY SOLIDS TABLE 6.4
CONCENTRATION Coefficients for Vesilind Equation for Different
Suspensions
As illustrated in Figure 6.2, particles in a Type III suspension
settle with a distinct interface, leaving a clear supernatant above Floc v I (m=h) b (L=mg) Reference
the top of the sludge blanket. As the particles approach the
Activated 18.6 0.00076 Wahlberg et al. (1993)
bottom and accumulate, a transition occurs to a Type IV sus- a
sludge
pension, characterized by compression and decreasing velocity.
Activated 7.62 0.00024 Watts et al. (1996)
sludge
6.6.1.1 Settling Tests
Activated 6.37 0.00092 Dick (1970)
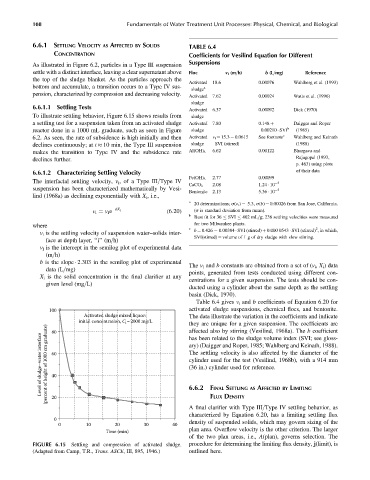
To illustrate settling behavior, Figure 6.15 shows results from sludge
a settling test for a suspension taken from an activated sludge Activated 7.80 0.148 þ Daigger and Roper
reactor done in a 1000 mL graduate, such as seen in Figure sludge 0.00210 SVI b (1985)
6.2. As seen, the rate of subsidence is high initially and then Activated v I ¼ 15.3 0.0615 See footnote c Wahlberg and Keinath
declines continuously; at t 10 min, the Type III suspension sludge SVI (stirred) (1988)
makes the transition to Type IV and the subsidence rate Al(OH) 3 6.62 0.00122 Bhargava and
declines further. Rajagopal (1993,
p. 463) using plots
6.6.1.2 Characterizing Settling Velocity of their data
2.77 0.00099
Fe(OH) 3
The interfacial settling velocity, v i , of a Type III=Type IV 5
CaCO 3 2.08 1.24 10
suspension has been characterized mathematically by Vesi- 5
Bentonite 2.13 5.36 10
lind (1968a) as declining exponentially with X i , i.e.,
a
20 determinations; s(v I ) ¼ 5.3, s(b) ¼ 0.00026 from San Jose, California.
v i ¼ v I e bX i (6:20) (s is standard deviation from mean).
b
Best fit for 36 SVI 402 mL=g; 236 settling velocities were measured
where for two Milwaukee plants.
2
c b ¼ 0.426 0.00384 SVI (stirred) þ 0.000 0543 SVI (stirred) , in which,
v i is the settling velocity of suspension water–solids inter-
SVI(stirred) ¼ volume of 1 g of dry sludge with slow stirring.
face at depth layer, ‘‘i’’ (m=h)
v I is the intercept in the semilog plot of experimental data
(m=h)
b is the slope 2.303 in the semilog plot of experimental
The v I and b constants are obtained from a set of (v i , X i ) data
data (L=mg)
points, generated from tests conducted using different con-
X i is the solid concentration in the final clarifier at any
centrations for a given suspension. The tests should be con-
given level (mg=L)
ducted using a cylinder about the same depth as the settling
basin (Dick, 1970).
Table 6.4 gives v i and b coefficients of Equation 6.20 for
100 activated sludge suspensions, chemical flocs, and bentonite.
Activated sludge mixed liquor: The data illustrate the variation in the coefficients and indicate
initial concentration, C =2000 mg/L they are unique for a given suspension. The coefficients are
i
affected also by stirring (Vesilind, 1968a). The b coefficient
80
Level of sludge–water interface (percent of height of 1000 cm graduate) 60 ary) (Daigger and Roper, 1985; Wahlberg and Keinath, 1988).
has been related to the sludge volume index (SVI; see gloss-
The settling velocity is also affected by the diameter of the
cylinder used for the test (Vesilind, 1968b), with a 914 mm
(36 in.) cylinder used for reference.
40
6.6.2 FINAL SETTLING AS AFFECTED BY LIMITING
FLUX DENSITY
20
A final clarifier with Type III=Type IV settling behavior, as
characterized by Equation 6.20, has a limiting settling flux
0
0 10 20 30 40 density of suspended solids, which may govern sizing of the
plan area. Overflow velocity is the other criterion. The larger
Time (min)
of the two plan areas, i.e., A(plan), governs selection. The
FIGURE 6.15 Settling and compression of activated sludge. procedure for determining the limiting flux density, j(limit), is
(Adapted from Camp, T.R., Trans. ASCE, III, 895, 1946.) outlined here.