
Page 315 - Fundamentals of Water Treatment Unit Processes : Physical, Chemical, and Biological
P. 315
270 Fundamentals of Water Treatment Unit Processes: Physical, Chemical, and Biological
10.4.2.4.1 Geometry lished, e.g., its P vs. R curve, as seen in Figure 10.15, was
Mixing tanks are usually circular or square in plan view. The based on literally hundreds of data points and the system has
proportions for a circular tank (Oldshue, 1983, p. 12; McCabe been used often in practice.
et al. 1993, p. 241) are H=T ¼ 1 (water depth, H, to tank The Rushton basin is scaled to fit the situation at hand and
diameter, T ). A recommended impeller diameter is 0.5T < is based on the volume of the basin, i.e., V ¼ Qu, with deten-
D(impeller) < 0.8T (McCabe et al., 1993). If H=T ¼ 1, the tion time, u, specified to be the same for model and prototype.
2
optimum impeller placement for blending is at 0.5H. With Q given, and since H ¼ T, then T(pT =4) ¼ V, yielding
the dimensions H and T. Since D(impeller) ¼ T=3, then the
10.4.2.4.2 Baffles other dimensions, may be calculated. As noted, however, in
A circular or square tank with impeller shaft in the center and Section 10.3.3.5, geometric scale-up does not result in both
oriented vertically and without baffles will cause the whole dynamic and kinematic similarity.
fluid mass to ‘‘swirl,’’ creating a vortex. With baffles, the
rotation of the fluid mass will be reduced and the vortex
10.4.2.6 In-Line Mixers
may be eliminated. The general guideline baffle width, J, for
An ‘‘in-line’’ mixer (one of several types of ‘‘flash’’ mixers)
a tank with six baffles, is, J, T=12 J T=10 (Oldshue, 1983,
consists of an impeller located in a pipe; Figure 10.16b is an
p. 17). If the baffles do not reach the bottom of the tank, then
example. As seen, the impeller is open to the raw-water flow
solids accumulation in the tank bottom may be reduced. For a
of the pipe. A key feature is that there is not a confining
square tank, the same sizing guidelines apply except only four
geometry and the raw-water flow passes across the impellers
baffles are used. Another approach is to set the shaft of the
just once. The flow pattern is that of pipe flow, i.e., straight
impeller at some location other than the center, or by tilting
lines parallel to the pipe, distorted by the superimposed cir-
the axis of the pump at some angle to the vertical.
culation pattern of the impeller.
10.4.2.4.3 Draft Tubes As with back-mix reactors, numerous configurations exist
Figure 10.2a is a schematic drawing of a draft tube system. As for in-line mixing. Figure 10.16b, illustrates a case in which
a rule, a draft tube is used with a marine impeller and helps to two ‘‘mixed-flow’’ impellers (300 mm, 12 in. diameter) each
control the direction and velocity of the flow (McCabe et al., cause flow both outward and toward the center of a 910 mm
1993, p. 241). (36 in.) diameter pipe; the two tubes entering from the side are
for a neat alum solution and=or a polymer, respectively. The
10.4.2.5 Rushton System advective flow for the top impeller is down and is up for the
A particular impeller–basin combination used by Rushton bottom impeller. The two advective flows meet halfway
et al. (1950a,b) to develop similitude relations was later des- between the two impellers with a resulting turbulence and in
ignated a ‘‘Rushton basin,’’ which became a quasi-standard which the two chemicals are mixed with the raw-water flow.
for comparing with other mixing systems. Its proportions are Further mixing occurs by hydraulic dispersion within the pipe.
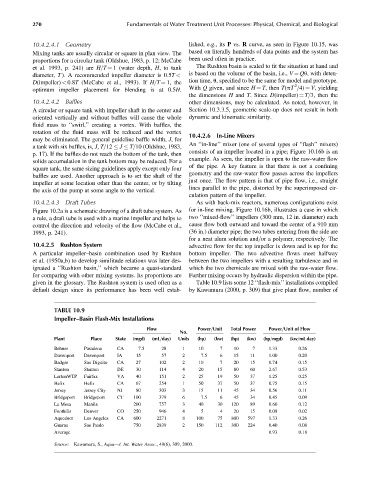
given in the glossary. The Rushton system is used often as a Table 10.9 lists some 12 ‘‘flash-mix’’ installations compiled
default design since its performance has been well estab- by Kawamura (2000, p. 309) that give plant flow, number of
TABLE 10.9
Impeller–Basin Flash-Mix Installations
Flow Power=Unit Total Power Power=Unit of Flow
No.
Plant Place State (mgd) (mL=day) Units (hp) (kw) (hp) (kw) (hp=mgd) (kw=mL day)
Behner Pasadena CA 7.5 28 1 10 7 10 7 1.33 0.26
Davenport Davenport IA 15 57 2 7.5 6 15 11 1.00 0.20
Badger San Diguito CA 27 102 2 10 7 20 15 0.74 0.15
Stanton Stanton DE 30 114 4 20 15 80 60 2.67 0.53
LartonWTP Fairfax VA 40 151 2 25 19 50 37 1.25 0.25
Helix Helix CA 67 254 1 50 37 50 37 0.75 0.15
Jersey Jersey City NJ 80 303 3 15 11 45 34 0.56 0.11
Bridgeport Bridgeport CT 100 379 6 7.5 6 45 34 0.45 0.09
La Mesa Manila 200 757 3 40 30 120 89 0.60 0.12
Foothills Denver CO 250 946 4 5 4 20 15 0.08 0.02
Aqueduct Los Angeles CA 600 2271 8 100 75 800 597 1.33 0.26
Guarau Sao Paulo 750 2839 2 150 112 300 224 0.40 0.08
Average 0.93 0.18
Source: Kawamura, S., Aqua—J. Int. Water Assoc., 49(6), 309, 2000.