
Page 587 - Fundamentals of Water Treatment Unit Processes : Physical, Chemical, and Biological
P. 587
542 Fundamentals of Water Treatment Unit Processes: Physical, Chemical, and Biological
3
weeks to several months, depending on how long in operation (Hanft, 2005): United States, 16.3 10 6 m =day (4300
6
3
before the flux decline exceeds about 10% (or how long for mgd); Europe, 2.8 10 m =day (750 mgd); Asia=Pacific,
3
6
the pressure increase to exceed 10%). Usually, this time 1.9 10 m =day (500 mgd); Middle East=Africa, 4.2 10 6
3
should be >30 day for a membrane process to be acceptable. m =day (1100 mgd); and Caribbean=Latin America, 0.5 10 6
3
Chemicals may include a detergent, citric acid, a specialized m =day (140 mgd). The total, that is, global, 2005 RO cap-
3
proprietary chemical, or some combination in sequence. Hol- acity was therefore 25.7 million m =day (6790 mgd). This
low fiber membranes may be cleaned by a pulse of water number compares with a global, 2005 desalting capacity of
3
every 0.5–1 min, with more complete chemical cleaning after 47 million m =day (12,400 mgd), spread among 12,300 pro-
several weeks. jects in 155 countries (Abstract, Global Water Intelligence
(GWI), 2006). In the twenty-first IDA survey (GWI, 2008),
the installed desalination capacity was given as 52 million
17.1.2 GLOBAL CAPACITY 3
m =day (13,800 mgd), with fractions distributed among the
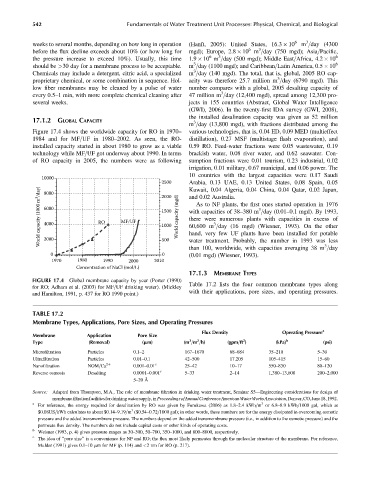
Figure 17.4 shows the worldwide capacity for RO in 1970– various technologies, that is, 0.04 ED, 0.09 MED (multieffect
1984 and for MF=UF in 1980–2002. As seen, the RO- distillation), 0.27 MSF (multistage flash evaporation), and
installed capacity started in about 1980 to grow as a viable 0.59 RO. Feed-water fractions were 0.05 wastewater, 0.19
technology while MF=UF got underway about 1990. In terms brackish water, 0.08 river water, and 0.62 seawater. Con-
of RO capacity in 2005, the numbers were as following sumption fractions were 0.01 tourism, 0.23 industrial, 0.02
irrigation, 0.01 military, 0.67 municipal, and 0.06 power. The
10 countries with the largest capacities were 0.17 Saudi
10000
2500 Arabia, 0.13 UAE, 0.13 United States, 0.08 Spain, 0.05
World capacity (1000 m 3 /day) 6000 RO MF/UF 1500 World capacity (mgd) with capacities of 38–380 m =day (0.01–0.1 mgd). By 1993,
Kuwait, 0.04 Algeria, 0.04 China, 0.04 Qatar, 0.02 Japan,
8000
2000
and 0.02 Australia.
As to NF plants, the first ones started operation in 1976
3
there were numerous plants with capacities in excess of
4000
3
1000
60,600 m =day (16 mgd) (Wiesner, 1993). On the other
hand, very few UF plants have been installed for potable
2000
500
water treatment. Probably, the number in 1993 was less
3
than 100, worldwide, with capacities averaging 38 m =day
0 0 (0.01 mgd) (Wiesner, 1993).
1970 1980 1990 2000 2010
Concentration of NaCl (mol/L)
17.1.3 MEMBRANE TYPES
FIGURE 17.4 Global membrane capacity by year (Porter (1990)
for RO; Adham et al. (2003) for MF=UF drinking water). (Mickley Table 17.2 lists the four common membrane types along
with their applications, pore sizes, and operating pressures.
and Hamilton, 1991, p. 437 for RO 1990 point.)
TABLE 17.2
Membrane Types, Applications, Pore Sizes, and Operating Pressures
Flux Density Operating Pressure a
Membrane Application Pore Size
2
2
3
Type (Removal) (mm) (m =m =h) (gpm=ft ) (kPa) b (psi)
Microfiltration Particles 0.1–2 167–1670 68–684 35–210 5–30
Ultrafiltration Particles 0.01–0.1 42–500 17.205 105–415 15–60
Nanofiltration NOM=Ca 2þ 0.001–0.01 c 25–42 10–17 550–830 80–120
Reverse osmosis Desalting 0.0001–0.001 c 5–33 2–14 1,380–13,600 200–2,000
5–20 Å
Source: Adapted from Thompson, M.A., The role of membrane filtration in drinking water treatment, Seminar S5—Engineering considerations for design of
membranefiltrationfacilitiesfordrinkingwatersupply,inProceedingsofAnnualConferenceAmericanWaterWorksAssociation,Denver,CO,June18,1992.
a 3
For reference, the energy required for desalination by RO was given by Furukawa (2006) as 1.8–2.4 kWh=m or 6.8–8.9 kWh=1000 gal, which at
3
$0.08US=kWh calculates to about $0.14–9.19=m ($0.54–0.72=1000 gal); in other words, these numbers are for the energy dissipated in overcoming osmotic
pressure and the added transmembrane pressure. The numbers depend on the added transmembrane pressure (i.e., in addition to the osmotic pressure) and the
permeate flux density. The numbers do not include capital costs or other kinds of operating costs.
b
Weisner (1993, p. 4) gives pressure ranges as 30–300, 50–700, 350–1000, and 800–8000, respectively.
c
The idea of ‘‘pore size’’ is a convenience for NF and RO; the flux most likely permeates through the molecular structure of the membrane. For reference,
Mulder (1991) gives 0.1–10 mm for MF (p. 114) and <2 nm for RO (p. 217).