
Page 592 - Fundamentals of Water Treatment Unit Processes : Physical, Chemical, and Biological
P. 592
Membrane Processes 547
Particles
Feed
Conc.
Feed flow Concentrate
Q Q
(a) Permeate F C
Concentrate Permeate
Membrane Q P
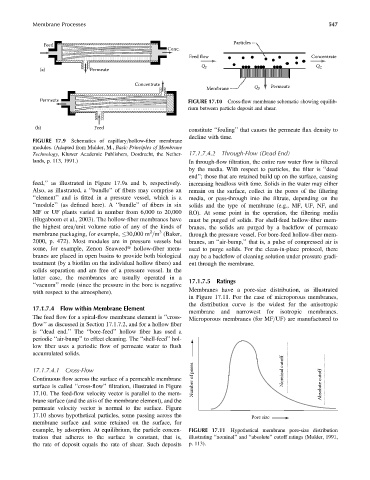
Permeate FIGURE 17.10 Cross-flow membrane schematic showing equilib-
rium between particle deposit and shear.
(b) Feed
constitute ‘‘fouling’’ that causes the permeate flux density to
decline with time.
FIGURE 17.9 Schematics of capillary=hollow-fiber membrane
modules. (Adapted from Mulder, M., Basic Principles of Membrane
Technology, Kluwer Academic Publishers, Dordrecht, the Nether- 17.1.7.4.2 Through-Flow (Dead End)
lands, p. 113, 1991.) In through-flow filtration, the entire raw water flow is filtered
by the media. With respect to particles, the filter is ‘‘dead
end’’; those that are retained build up on the surface, causing
feed,’’ as illustrated in Figure 17.9a and b, respectively. increasing headloss with time. Solids in the water may either
Also,asillustrated,a ‘‘bundle’’ of fibers may comprise an remain on the surface, collect in the pores of the filtering
‘‘element’’ and is fittedinapressurevessel, whichisa media, or pass-through into the filtrate, depending on the
‘‘module’’ (as defined here). A ‘‘bundle’’ of fibers in six solids and the type of membrane (e.g., MF, UF, NF, and
MF or UF plants varied in number from 6,000 to 20,000 RO). At some point in the operation, the filtering media
(Hugaboom et al., 2003). The hollow-fiber membranes have must be purged of solids. For shell-feed hollow-fiber mem-
the highest area=unit volume ratio of any of the kinds of branes, the solids are purged by a backflow of permeate
2
3
membrane packaging, for example, 30,000 m =m (Baker, through the pressure vessel. For bore-feed hollow-fiber mem-
2000, p. 472). Most modules are in pressure vessels but branes, an ‘‘air-bump,’’ that is, a pulse of compressed air is
some, for example, Zenon Seaweedt hollow-fiber mem- used to purge solids. For the clean-in-place protocol, there
branes are placed in open basins to provide both biological may be a backflow of cleaning solution under pressure gradi-
treatment (by a biofilm on the individual hollow fibers) and ent through the membrane.
solids separation and are free of a pressure vessel. In the
latter case, the membranes are usually operated in a
17.1.7.5 Ratings
‘‘vacuum’’ mode (since the pressure in the bore is negative
Membranes have a pore-size distribution, as illustrated
with respect to the atmosphere).
in Figure 17.11. For the case of microporous membranes,
the distribution curve is the widest for the anisotropic
17.1.7.4 Flow within Membrane Element
membrane and narrowest for isotropic membranes.
The feed flow for a spiral-flow membrane element is ‘‘cross- Microporous membranes (for MF=UF) are manufactured to
flow’’ as discussed in Section 17.1.7.2, and for a hollow fiber
is ‘‘dead end.’’ The ‘‘bore-feed’’ hollow fiber has used a
periodic ‘‘air-bump’’ to effect cleaning. The ‘‘shell-feed’’ hol-
low fiber uses a periodic flow of permeate water to flush
accumulated solids.
17.1.7.4.1 Cross-Flow Nominal cutoff
Continuous flow across the surface of a permeable membrane Number of pores
surface is called ‘‘cross-flow’’ filtration, illustrated in Figure Absolute cutoff
17.10. The feed-flow velocity vector is parallel to the mem-
brane surface (and the axis of the membrane element), and the
permeate velocity vector is normal to the surface. Figure
17.10 shows hypothetical particles, some passing across the Pore size
membrane surface and some retained on the surface, for
example, by adsorption. At equilibrium, the particle concen- FIGURE 17.11 Hypothetical membrane pore-size distribution
tration that adheres to the surface is constant, that is, illustrating ‘‘nominal’’ and ‘‘absolute’’ cutoff ratings (Mulder, 1991,
the rate of deposit equals the rate of shear. Such deposits p. 113).