Page 256 - gas transport in porous media
P. 256

253
                           Chapter 14: Experimental Determination of Transport Parameters
                           with gas B (gas system (A + B) vs. B) or with another gas C (gas system (A + C) vs.
                           B) in order to increase the confidence of evaluated transport parameters. Equations
                           corresponding to the use of more than two gases can be found elsewhere (Šolcová
                           et al., 2001).
                             With boundary conditions
                                                       L
                                                                   U
                                                               L
                                                  U
                                                 y = y = 1    y = y = 0
                                                  A    B      A    B
                           the integration of differential Equation (14.21) with the Graham’s law (14.23) on
                           application of Eqs. (14.4) and (14.5) yields
                                                                        m

                                        d     d    d  c T   m     1 + D / r K A
                                                                        AB
                                       N = N + N =       ψD   ln                        (14.25)
                                             A    B         AB            m
                                                       L        1 − α + D / r K A
                                                                          AB
                                                       d
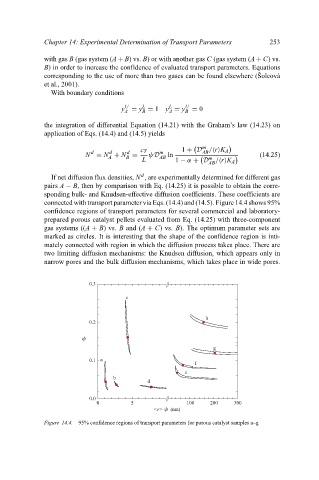
                             If net diffusion flux densities, N , are experimentally determined for different gas
                           pairs A − B, then by comparison with Eq. (14.25) it is possible to obtain the corre-
                           sponding bulk- and Knudsen-effective diffusion coefficients. These coefficients are
                           connected with transport parameter via Eqs. (14.4) and (14.5). Figure 14.4 shows 95%
                           confidence regions of transport parameters for several commercial and laboratory-
                           prepared porous catalyst pellets evaluated from Eq. (14.25) with three-component
                           gas systems ((A + B) vs. B and (A + C) vs. B). The optimum parameter sets are
                           marked as circles. It is interesting that the shape of the confidence region is inti-
                           mately connected with region in which the diffusion process takes place. There are
                           two limiting diffusion mechanisms: the Knudsen diffusion, which appears only in
                           narrow pores and the bulk diffusion mechanisms, which takes place in wide pores.


                                        0.3
                                        0.3
                                                  c

                                                                         h
                                        0.2
                                        0.2
                                      c
                                                                           g
                                        0.1 a
                                        0.1
                                                                      f
                                                                   e
                                               b
                                                        d
                                        0.0
                                        0.0
                                                                    100
                                                                                 30
                                                                          200
                                          0 0 0     5 5 5           100   200    300 0
                                                          <r> c  (nm)
                           Figure 14.4.  95% confidence regions of transport parameters for porous catalyst samples a–g
   251   252   253   254   255   256   257   258   259   260   261