
Page 262 - gas transport in porous media
P. 262
Chapter 14: Experimental Determination of Transport Parameters
2 3 259
t dif .K T . 10 –5 (cm) 1
0
0 1 2 3
K /D m . 10 (cm )
–1
–5
TC
T
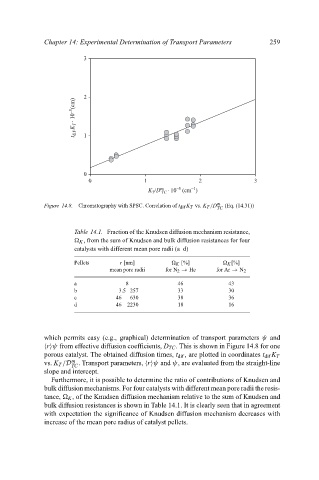
Figure 14.8. Chromatography with SPSC. Correlation of t dif K T vs. K T /D m (Eq. (14.31))
TC
Table 14.1. Fraction of the Knudsen diffusion mechanism resistance,
K , from the sum of Knudsen and bulk diffusion resistances for four
catalysts with different mean pore radii (a–d)
Pellets r [nm] K [%] K [%]
mean pore radii for N 2 → He for Ar → N 2
a 8 46 43
b 3.5 257 33 30
c 46 630 38 36
d 46 2230 18 16
which permits easy (e.g., graphical) determination of transport parameters ψ and
r ψ from effective diffusion coefficients, D TC . This is shown in Figure 14.8 for one
porous catalyst. The obtained diffusion times, t dif , are plotted in coordinates t dif K T
m
vs. K T /D . Transport parameters, r ψ and ψ, are evaluated from the straight-line
TC
slope and intercept.
Furthermore, it is possible to determine the ratio of contributions of Knudsen and
bulk diffusion mechanisms. For four catalysts with different mean pore radii the resis-
tance, K , of the Knudsen diffusion mechanism relative to the sum of Knudsen and
bulk diffusion resistances is shown in Table 14.1. It is clearly seen that in agreement
with expectation the significance of Knudsen diffusion mechanism decreases with
increase of the mean pore radius of catalyst pellets.