
Page 266 - gas transport in porous media
P. 266
Chapter 14: Experimental Determination of Transport Parameters
0.06 6 263
B (cm 2 /s) 0.04 4 B (cm 2 /s)
0.02 2
0.00 0
0 50 1000 50 100
p (kPa) p (kPa)
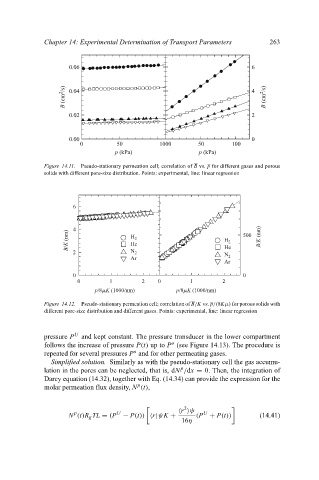
Figure 14.11. Pseudo-stationary permeation cell; correlation of B vs. p for different gases and porous
solids with different pore-size distribution. Points: experimental, line: linear regression
6
4
B/K (nm) H 2 H 2 500 B/K (nm)
He
2 N 2 He
N 2
Ar
Ar
0 0
0 1 2 0 1 2
p/8mK (1000/nm) p/8mK (1000/nm)
Figure 14.12. Pseudo-stationary permeation cell; correlation of B/K vs. p/(8Kµ) for porous solids with
different pore-size distribution and different gases. Points: experimental, line: linear regression
pressure P U and kept constant. The pressure transducer in the lower compartment
o
follows the increase of pressure P(t) up to P (see Figure 14.13). The procedure is
o
repeated for several pressures P and for other permeating gases.
Simplified solution. Similarly as with the pseudo-stationary cell the gas accumu-
p
lation in the pores can be neglected, that is, dN /dx = 0. Then, the integration of
Darcy equation (14.32), together with Eq. (14.34) can provide the expression for the
p
molar permeation flux density, N (t),
2
r ψ
p U U
N (t)R g TL = (P − P(t)) r ψK + (P + P(t)) (14.41)
16η