Page 265 - gas transport in porous media
P. 265

262
                                                                            Šolcová and Schneider
                                                                           2.8
                                            600                            3.0
                                                                           2.6
                                                                           2.4
                                          ∆P (Pa)                          2.2  log (∆P/Pa)
                                            400
                                                                           2.0
                                            200
                                                                           1.8
                                                                           1.6
                                              0                            1.4
                                               0        200       400
                                                           t (s)

                                                                                           o
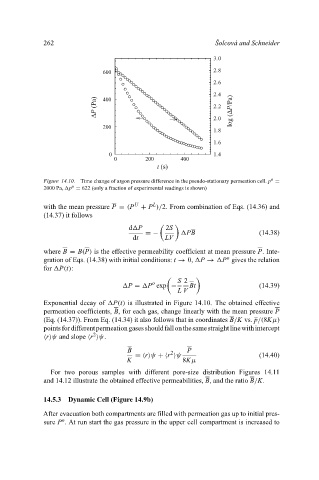
                           Figure 14.10. Time change of argon pressure difference in the pseudo-stationary permeation cell. p =
                                   o
                           2000 Pa,  p = 622 (only a fraction of experimental readings is shown)
                                                          L
                                                     U
                           with the mean pressure P = (P + P )/2. From combination of Eqs. (14.36) and
                           (14.37) it follows

                                                   d P        2S
                                                        =−         PB                   (14.38)
                                                    dt       LV
                           where B = B(P) is the effective permeability coefficient at mean pressure P. Inte-
                                                                               o
                           gration of Eqs. (14.38) with initial conditions: t → 0,  P →  P gives the relation
                           for  P(t):

                                                                 S 2
                                                          o
                                                  P =  P exp −      Bt                  (14.39)
                                                                 L V
                           Exponential decay of  P(t) is illustrated in Figure 14.10. The obtained effective
                           permeation coefficients, B, for each gas, change linearly with the mean pressure P
                           (Eq. (14.37)). From Eq. (14.34) it also follows that in coordinates B/K vs. p/(8Kµ)
                           pointsfordifferentpermeationgasesshouldfallonthesamestraightlinewithintercept
                                         2
                            r ψ and slope  r  ψ.
                                                   B           2    P
                                                     = r ψ + r  ψ                       (14.40)
                                                   K              8Kµ
                             For two porous samples with different pore-size distribution Figures 14.11
                           and 14.12 illustrate the obtained effective permeabilities, B, and the ratio B/K.


                           14.5.3  Dynamic Cell (Figure 14.9b)
                           After evacuation both compartments are filled with permeation gas up to initial pres-
                                o
                           sure P . At run start the gas pressure in the upper cell compartment is increased to
   260   261   262   263   264   265   266   267   268   269   270