Page 107 - Handbook of Battery Materials
P. 107

2.7 Lithium-Ion Batteries  73

                                                                   3.5
                                                                  Potential (V vs. Li/Li + )  2.5  C
                                                                   3.0
                                                                   2.0
                      A                B               C           1.5
                    (002)            (002)            (002)                 B
                    2 q = 24.0°      2 q = 25.6°      2 q = 26.5°  1.0            A
                         C Li             C 12 Li           C      0.5 0
                          6
                                                                     0  100  200  300  400
                                                                       Charge capacity (mAh/g)


               15  20  25  30  35 15  20  25  30  35 15  20  25  30  35
                   2 q (degree)     2 q (degree)     2 q (degree)

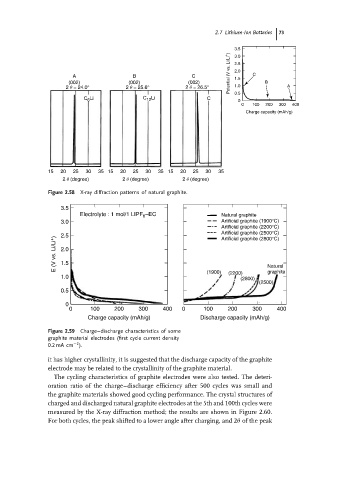
               Figure 2.58  X-ray diffraction patterns of natural graphite.
                  3.5
                        Electrolyte : 1 mol/1 LIPF 6 –EC        Natural graphite
                  3.0                                           Artificial graphite (1900°C)
                                                                Artificial graphite (2200°C)
                                                                Artificial graphite (2500°C)
                  2.5                                           Artificial graphite (2800°C)
                 E (V vs. Li/Li + )  2.0

                  1.5
                                                                             graphite
                  1.0                                       (1900)  (2200)   Natural
                                                                     (2800)
                                                                          (2500)
                  0.5
                    0
                     0     100   200    300    400   0     100    200    300   400
                          Charge capacity (mAh/g)         Discharge capacity (mAh/g)
               Figure 2.59  Charge–discharge characteristics of some
               graphite material electrodes (first cycle current density
                      −2
               0.2 mA cm ).
               it has higher crystallinity, it is suggested that the discharge capacity of the graphite
               electrode may be related to the crystallinity of the graphite material.
                The cycling characteristics of graphite electrodes were also tested. The deteri-
               oration ratio of the charge–discharge efficiency after 500 cycles was small and
               the graphite materials showed good cycling performance. The crystal structures of
               charged and discharged natural graphite electrodes at the 5th and 100th cycles were
               measured by the X-ray diffraction method; the results are shown in Figure 2.60.
               For both cycles, the peak shifted to a lower angle after charging, and 2θ of the peak
   102   103   104   105   106   107   108   109   110   111   112