
Page 152 - Handbook of Materials Failure Analysis
P. 152
148 CHAPTER 6 Failure analysis of concrete sleepers/bearers
q
602.75
4055
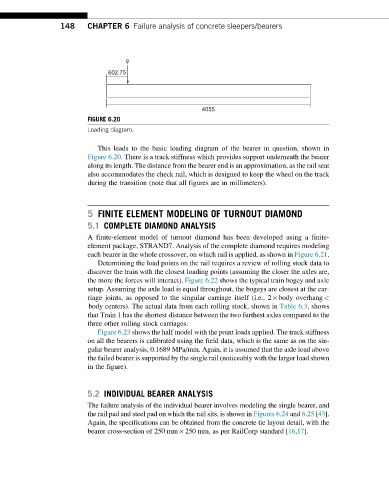
FIGURE 6.20
Loading diagram.
This leads to the basic loading diagram of the bearer in question, shown in
Figure 6.20. There is a track stiffness which provides support underneath the bearer
along its length. The distance from the bearer end is an approximation, as the rail seat
also accommodates the check rail, which is designed to keep the wheel on the track
during the transition (note that all figures are in millimeters).
5 FINITE ELEMENT MODELING OF TURNOUT DIAMOND
5.1 COMPLETE DIAMOND ANALYSIS
A finite-element model of turnout diamond has been developed using a finite-
element package, STRAND7. Analysis of the complete diamond requires modeling
each bearer in the whole crossover, on which rail is applied, as shown in Figure 6.21.
Determining the load points on the rail requires a review of rolling stock data to
discover the train with the closest loading points (assuming the closer the axles are,
the more the forces will interact). Figure 6.22 shows the typical train bogey and axle
setup. Assuming the axle load is equal throughout, the bogeys are closest at the car-
riage joints, as opposed to the singular carriage itself (i.e., 2 body overhang<
body centers). The actual data from each rolling stock, shown in Table 6.3, shows
that Train 1 has the shortest distance between the two furthest axles compared to the
three other rolling stock carriages.
Figure 6.23 shows the half model with the point loads applied. The track stiffness
on all the bearers is calibrated using the field data, which is the same as on the sin-
gular bearer analysis, 0.1689 MPa/mm. Again, it is assumed that the axle load above
the failed bearer is supported by the single rail (noticeably with the larger load shown
in the figure).
5.2 INDIVIDUAL BEARER ANALYSIS
The failure analysis of the individual bearer involves modeling the single bearer, and
the rail pad and steel pad on which the rail sits, is shown in Figures 6.24 and 6.25 [43].
Again, the specifications can be obtained from the concrete tie layout detail, with the
bearer cross-section of 250 mm 250 mm, as per RailCorp standard [16,17].