
Page 80 - Handbook of Materials Failure Analysis
P. 80
74 CHAPTER 4 Creep damage of high alloyed reformer tubes
In order to estimate the long-term creep properties using results obtained over a
short period, a number of time-temperature parameters have been developed. Among
these, the Larson-Miller parameter (LMP) is the most commonly used around the
world since the middle of the last century [18]. It is a means of predicting lifetime
of materials using a correlative approach based on the Arrhenius relationship for
thermal-activated processes.
Creep tests are carried out to evaluate the rupture times corresponding to the
experimental values of temperature and applied load. The applied creep stresses
(σ) are plotted versus the LMP values, expressed as follow:
LMP ¼ TC + logtÞ=1000 (4.2)
ð
being T (°K) the test temperature, t (h) the rupture time, and C a material constant
equal to 20 for ferritic steels and 15 for austenitic stainless steel. For the alloy
under consideration, C¼22.9.
At a given stress, the LMP value is constant for a given material. So it is conve-
nient to carry out accelerated creep tests at high temperatures to have short rupture
times and calculate the corresponding LMP values: in this way, it is possible to pre-
dict very long rupture times at the specific service conditions that are characterized
by the same applied stresses and lower temperatures than tests.
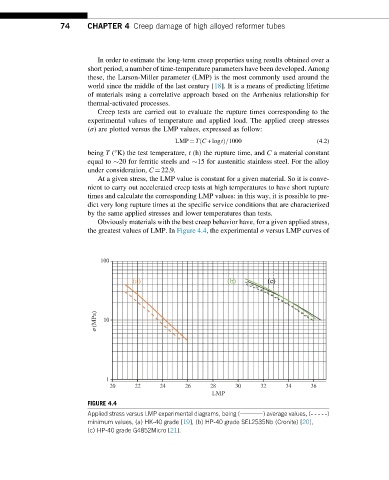
Obviously materials with the best creep behavior have, for a given applied stress,
the greatest values of LMP. In Figure 4.4, the experimental σ versus LMP curves of
100
(a) (b) (c)
s (MPa) 10
1
20 22 24 26 28 30 32 34 36
LMP
FIGURE 4.4
Applied stress versus LMP experimental diagrams, being (dddd) average values, (- - - - -)
minimum values, (a) HK-40 grade [19], (b) HP-40 grade SEL2535Nb (Cronite) [20],
(c) HP-40 grade G4852Micro [21].