
Page 33 - Industrial Power Engineering and Applications Handbook
P. 33
1/14 Industrial Power Engineering and Applications Handbook
on this, a designer can take corrective action to minimize (vi) Pegormance of the driven equipment
these losses. The speed of the motor is affected slightly as is the
For all practical purposes, the core losses may be speed of the driven load. Since the output of the load is
regarded as proportional to the square of the flux density. a function of speed, it is also affected although only
With a reduction in voltage, the flux 41 and so the flux marginally, unless the variation in the voltage is substantial,
density B will decrease in the same proportion as the which may also cause a substantial reduction in speed.
voltage and so will the core losses. The poorer the speed-torque characteristic of the motor,
As a rough estimate, except for a rise or fall in the the higher will be the speed variation, as illustrated in
current drawn by the stator, at lower and higher voltages Figure 1.8.
respectively, the variation in the Z2R loss will be more or
less counterbalanced by the fall or rise in the core loss. B Effect of frequency variation
The core loss is proportional to B2, provided that no- On a 34 system the frequency variation is normally
load iron loss and full-load resistive loss are roughly within limits, which according to IEC 60034-1 is k 2%
equal, which is so for most designs. A comparatively (Figure 1.6). The reason for keeping the frequency
higher resistive loss to core loss will result in a higher variation low is that it is not influenced by any condition
f2R loss at lower voltages compared to a corresponding outside the generating point, and at the generating point,
reduction in the no-load loss and vice versa. While on it is maintained constant through automatic speed regula-
no-load, the no-load current will be more or less according tion of the prime mover (frequency is directly proportional
to the square of the voltage. to the speed, equation (1.6a)). The effect of frequency
variation, however small, is discussed below:
(v) Effect on power factor, efficiency and speed (i) Speed Since the speed is proportional to frequency,
At lower voltages the rotor will adjust its speed at a it is affected the most and in turn influences the
higher slip. The extent of slip will depend upon the speed- performance of the driven equipment in the same
torque characteristics of the motor and the supply voltage. proportion as its relation to the speed.
The efficiency is now low but the power factor better, (ii) Slip The motor adjusts its speed according to the
due to the lower inductive core loss. These figures are frequency and therefore there is no change in the
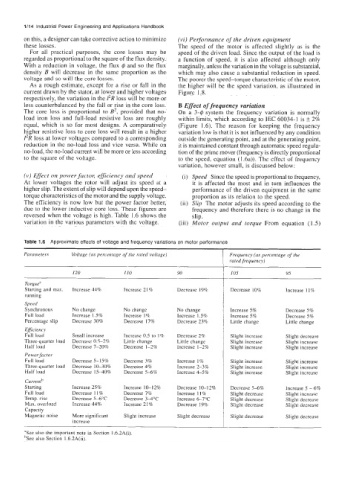
reversed when the voltage is high. Table 1.6 shows the slip.
variation in the various parameters with the voltage. (iii) Motor output and torque From equation (1.5)
Table 1.6 Approximate effects of voltage and frequency variations on motor performance
~
Parameters Voltage (as percentege of the rated voltage) Frequency (as percentage of the
rated frequency)
120 110 YO I05 9.5
Torque"
Starting and max Increase 44% Increase 2 1 % Decrease 19% Decrease 10% Increase 1 15%
running
Speed
Synchronous No change No change No change Increase 5% Decrease 5%
Full load Increase 1.5% Increase 1% Increase 1.5% Increase 5% Decrease 5%
Percentage slip Decrease 30% Decrease 17% Decrease 23% Little change Little change
Eflciency
Full load Small increase Increase 0.5 to 1% Decrease 2% Slight increase Slight decrease
Three-quarter load Decreaqe 0 5-2% Little change Little change Slight increase Slight increase
Half load Decrease 7-20% Decrease I-2% Increase I-2% Slight increase Slight increase
Power factor
Full load Decrease 5-156 Decrease 3% Increase 1% Slight increase Slight increase
Three-quarter load Decrease 10-30% Decrease 4% Increase 2-3% Slight increase Slight increase
Half load Decrease 1540% Decrease 5-6% Increase 4-5% Slight increase Slight increase
Currentb
Starting Increase 25% Increase 10-12% Decrease 10-12% Decrease 5-6% Increase 5 - 6%
Full load Decrease 11 % Decrease 7% Increase 11% Slight decrease Slight increase
Temp. rise Decrease 5-6°C Decrease 34°C Increase 67°C Slight decrease Slight decrease
Max. overload Increase 44% Increase 21 % Decrease 19% Slight decrease Slight decrease
Capacity
Magnetic noise More significant Slight increase Slight decrease Slight decrease Slight decrease
increase
'See also the important note in Section 1.6.2A(i).
hSee also Section 1.6.2A(ii).