
Page 466 - Industrial Power Engineering and Applications Handbook
P. 466
14/440 Industrial Power Engineering and Applications Handbook
200,
N
(153.73 cm/se?j I
-200 I Time in seconds -
0 5 10 15 20 25
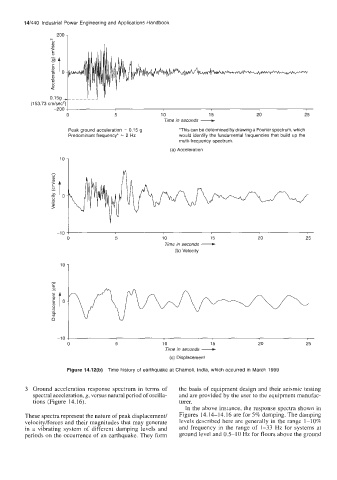
Peak ground acceleration = 0.15 g 'This can be determined by drawing a Fourier spectrum, which
Predominant frequency* = 2 Hz would identify the fundamental frequencies that build up the
multi-frequency spectrum.
(a) Acceleration
Time in seconds -
-8" I
0 5 10 15 20 25
(b) Velocity
lo 1
Time in seconds -
-10 I
0 5 10 15 20 25
(c) Displacement
Figure 14.12(b) Time history of earthquake at Charnoli, India, which occurred in March 1999
3 Ground acceleration response spectrum in terms of the basis of equipment design and their seismic testing
spectral acceleration, g, versus natural period of oscilla- and are provided by the user to the equipment manufac-
tions (Figure 14.16). turer.
In the above instance, the response spectra shown in
These spectra represent the nature of peak displacement/ Figures 14.14-14.16 are for 5% damping. The damping
velocity/forces and their magnitudes that may generate levels described here are generally in the range 1-10%
in a vibrating system of different damping levels and and frequency in the range of 1-33 Hz for systems at
periods on the occurrence of an earthquake. They form ground level and 0.5-10 Hz for floors above the ground