Page 465 - Industrial Power Engineering and Applications Handbook
P. 465
Testing of  metal-enclosed switchgear assemblies  14/439
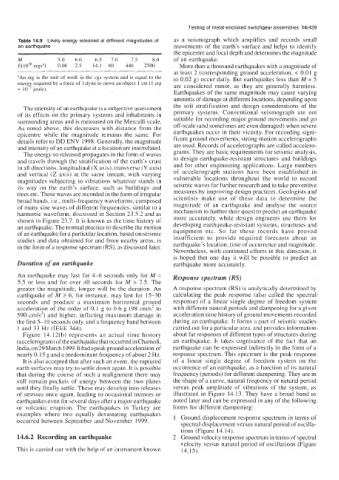
       Table 14.9  Likely energy released at different magnitudes of   as  a  seismograph  which  amplifies  and  records  small
       an earthquake                                  movements  of  the earth's  surface and helps  to identify
                                                      the epicentre and focal depth and determines the magnitude
       M           5.0   6.0   6.5   7.0   7.5   8.0   of an earthquake.
       E(1020 ergsa)   0.08   2.5   14.1  80   446   2500   More than a thousand earthquakes with a magnitude of
                                                      at least 2  (corresponding ground acceleration, < 0.01 g
       "An erg is the  unit of  work in the cgs system and is equal to the   to 0.02 g) occur daily. But earthquakes less than M  = 5
       energ  required by a force of  1 dyne to move an object 1 cm (1 erg
       = 10- Y. Joule).                               are  considered  minor,  as  they  are  generally  harmless.
                                                      Earthquakes of the same magnitude may cause varying
                                                      amounts of damage at different locations, depending upon
        The intensity of an earthquake is a subjective assessment   the  soil  stratification  and design considerations of  the
       of its effects on the primary  systems and inhabitants in   primary  systems.  Conventional seismograph are  not
       surrounding areas and is measured on the Mercalli scale.   suitable for recording major ground movements and go
       As noted  above, this  decreases  with  distance from the   off-scale (and sometimes are even damaged) when severe
       epicentre  while  the  magnitude  remains  the  same.  For   earthquakes occur in their vicinity. For recording signi-
       details refer to DD ENV 1998. Generally, the magnitude   ficant ground movements, strong motion accelerographs
       and intensity of an earthquake at a location are interrelated.   are used. Records of accelerographs are called accelero-
        The energy so released propagates in the form of waves   grams. They are basic requirements for seismic analysis,
       and travels through the stratification  of the earth's crust   to design earthquake-resistant structures and buildings
       in all directions, longitudinal (X axis), transverse (Y axis)   and for other engineering applications.  Large numbers
       and vertical  (Z axis) at the  same instant, with  varying   of  accelerograph  stations have  been  established  in
       magnitudes subjecting to vibrations whatever  stands in   vulnerable  locations  throughout  the  world  to  record
       its  way  on  the  earth's  surface,  such  as  buildings  and   seismic waves for further research and to take preventive
      trees etc. These waves are recorded in the form of irregular   measures by improving design practices. Geologists and
      broad bands, Le., multi-frequency waveforms, composed   scientists  make  use  of  these  data  to  determine  the
      of many sine waves of different frequencies, similar to a   magnitude  of  an  earthquake  and  analyse  the  source
      harmonic waveform, discussed in Section 23.5.2 and as   mechanism to further their quest to predict an earthquake
      shown in Figure 23.7. It is known as the time history of   more  accurately,  while  design  engineers use  them  for
      an earthquake. The normal practice to describe the motion   developing earthquake-resistant systems, structures and
      of an earthquake for a particular location, based on seismic   equipment  etc.  So  far  these  records  have  proved
       studies and data obtained for and from nearby  areas, is   insufficient  to  provide  required  forecasts  about  an
      in the form of a response spectrum (RS), as discussed later.   earthquake's location, time of occurrence and magnitude.
                                                      Nevertheless, with continued efforts in this direction, it
                                                      is hoped  that  one day it  will be possible  to predict  an
      Duration of an earthquake                       earthquake more accurately.

      An earthquake may last for 4-6  seconds only for M  =   Response spectrum (RS)
       5.5  or  less  and  for  over 40 seconds  for M  > 1.5. The
      greater  the magnitude, longer will  be  the duration. An   A response spectrum (RS) is analytically determined by
      earthquake of  M  2 6, for instance,  may  last for  15-30   calculating the peak response  (also  called  the  spectral
      seconds  and  produce  a  maximum  horizontal  ground   response)  of  a linear  single degree of  freedom  system
      acceleration  of the order of  0.1 g to 0.6 g (98 cds2 to   with different natural periods and dampening for a given
      590 cm/s2) and higher, inflicting maximum damage in   acceleration time history of ground movements recorded
      the first 5-10  seconds only, and a frequency band between   during an earthquake. It forms a part of  seismic studies
      1 and 33 Hz (IEEE 344).                         carried out for a particular area, and provides information
        Figure  14.12(b) represents an  actual  time  history   about far responses of different types of structures during
      (accelerogram) of the earthquake that occurred in Chamoli,   an  earthquake.  It  takes  cognisance  of  the  fact  that  an
      India, on 29 March 1999. It had apeak ground acceleration of   earthquake can be expressed indirectly in the form of a
      nearly 0.15 g and a predominant frequency of about 2 Hz.   response spectrum. This spectrum is the peak response
        It is also accepted that after such an event, the ruptured   of  a  linear  single degree  of  freedom  system  on  the
      earth surfaces may try to settle down again. It is possible   occurrence of an earthquake, as a function of its natural
      that during the course of such a realignment there may   frequency (periods) for different dampening. They are in
      still  remain  pockets  of  energy  between  the  two plates   the shape of a curve, natural frequency or natural period
      until they finally settle. These may develop into releases   versus  peak  amplitude  of  vibrations  of  the  system,  as
      of stresses once again, leading to occasional tremors or   illustrated  in Figure  14.13. They have a broad band  as
      earthquakes even for several days after a major earthquake   noted later and can be expressed in any of the following
      or  volcanic  eruption.  The earthquakes  in  Turkey  are   forms for different dampening:
      examples  where  two  equally  devastating  earthquakes   1  Ground displacement response spectrum in terms of
      occurred between September and November  1999.
                                                        spectral displacement versus natural period of oscilla-
                                                        tions (Figure 14.14).
      14.6.2 Recording an earthquake                  2  Ground velocity response spectrum in terms of spectral
                                                        velocity versus natural period of oscillations (Figure
      This is carried out with the help of an instrument known   14.15).

