
Page 468 - Industrial Power Engineering and Applications Handbook
P. 468
14/442 Industrial Power Engineering and Applications Handbook
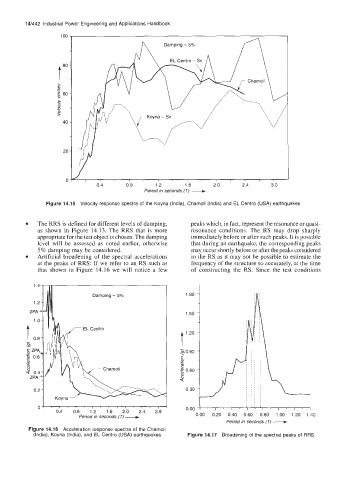
Figure 14.15 Velocity response spectra of the Koyna (India), Charnoli (India) and EL Centro (USA) earthquakes
The RRS is defined for different levels of damping, peaks which, in fact, represent the resonance or quasi-
as shown in Figure 14.13. The RRS that is more resonance conditions. The RS may drop sharply
appropriate for the test object is chosen. The damping immediately before or after such peaks. It is possible
level will be assessed as noted earlier, otherwise that during an earthquake, the corresponding peaks
5% damping may be considered. may occur shortly before or after the peaks considered
Artificial broadening of the spectral accelerations in the RS as it may not be possible to estimate the
at the peaks of RRS: If we refer to an RS such as frequency of the structure so accurately, at the time
that shown in Figure 14.16 we will notice a few of constructing the RS. Since the test conditions
1.80
1.50
t l'*O
0.90
C L
.2 c
??
0.60
0
9
0.30
Period in seconds (T) -
0.4 0.8 1.2 1.6 2.0 2.4 2.8 0.00
0.00 0.20 0.40 0.60 0.80 1.00 1.20 1.40
Period in seconds (T) --+
Figure 14.16 Acceleration response spectra of the Charnoli
(India), Koyna (India), and EL Centro (USA) earthquakes Figure 14.17 Broadening of the spectral peaks of RRS