Page 930 - Industrial Power Engineering and Applications Handbook
P. 930

28/880  Industrial Power Engineering and Applications Handbook

               200


               150


               100


                50


                                                Conductor spacing - 2 -
                 0
                  0     .5     1    1.5   2     2.5   3    3.5    4    4.5    5    5.5    6    6.5
                                                 Semi perimeter   a + b
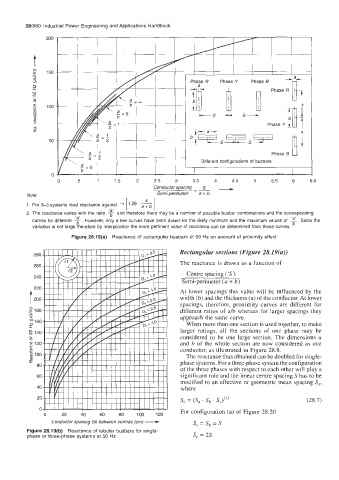
         1.  For 3-4 systems read reactance against  + [ .26  -
                                            asb]
                                  I  ,
         2. The reactance varies with the ratio $- and therefore there may be a number of  possible busbar combinations and the corresponding
                                                                                         <  I
           curves for different a However, only a few curves have been drawn for the likely minimum and the maximum values of  a Since the
                        b’
                                                                                          b’
           variation is not large therefore by interpolation the more pertinent value of  reactance can be determined from these curves.
                       Figure 28.19(a)  Reactance of  rectangular busbars at 50 Hz on account of proximity effect
                                                        Rectangular sections (Figure 28.19(a))
           280
                                                        Thc rcactancc is drawn as a function of
           260
                                                          Centre snacing (‘S?
           240                                          ~
                                                        Semi-perimeter (a + b)
           220
                                                        At lower spacings this value will  be  influenced  by  the
          -                                             width (b) and the thickness (a) of the conductor. At lower
           200
                                                        spacings,  therefore,  proximity  curves  are different for
                                                        different ratios of  a/b  whereas for larger spacings they
          6 180                                         approach the same curve.
          &160                                            When more than one section is used together, to make
          2
          ..                                            larger  ratings,  all  the  sections  of  one  phase  may  be
          $140
                                                        considered  to  be  one large  section. The  dimensions a
          8 120                                         and b of  the whole section are now considered  as one
          C                                             conductor, as illustrated in Figure 28.8.
          ,m
          8 100                                           The reactance thus obtained can be doubled for single-
          c?                                            phase systems. For a three-phase system the configuration
            80
                                                        of the three phases with respect to each other will play a
            60                                          significant role and the linear centre spacing S has to be
                                                        modified to an effective or geometric mean spacing S,,
            40                                          where
            20                                          s, = (Sa ‘ Sb  ’ S,)”3                (28.7)
                 Conductor spacing Se between centres (em) -   For configuration (a) of Figure 28.20
                      i
               Itm  i  i  FH i  i  i  i  i  i  i  i  i  i  i  i  ti iI
              0     20    40   60    80    100   120        sa = Sb = s
         Figure 28.19(b)  Reactance of  tubular busbars for single-
         phase or three-phase systems at 50 Hz              s, = 2s
   925   926   927   928   929   930   931   932   933   934   935