Page 926 - Industrial Power Engineering and Applications Handbook
P. 926

28/876 Industrial Power Engineering and Applications  Handbook

                                               OInOlOO  In
                                           I= Inb*@-Jrn   N  z
                                            d   ooooo o  o

                                                               1=015
                                                               d


                                                               'GO12
                                                               d

                                                               t  -=010
                                                               d
                                                               1=008
                                                               d
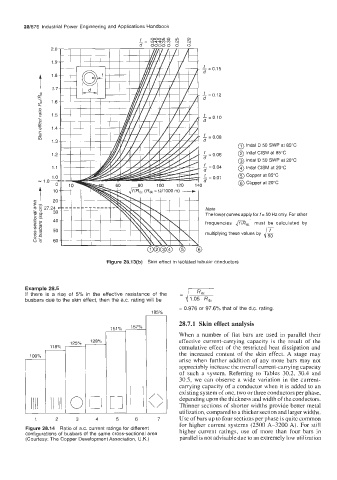
                                                                         @ lndal D 50 SWP at 85°C
                                                               I =  o6   @ lndal ClSM at 85°C
                                                               d
                                                                         @ lndal D 50 SWP at 20°C
                                                                = 0 04   @)  lndal ClSM at 20°C
                                                               d
                                                                         @ Copper at 85°C
                                                               '=OOl
                                                               d         @ Copper at 20°C

                                                               Note
                                                               The lower curves apply for f= 50 Hz only  For other
                                                               frequencies    must  be  calculated  by
                                                               multiplying these values by &


                                 Figure 28.13(b)  Skin effect in isolated tubular conductors


         Example 28.5
         If  there  is  a  rise  of  5%  in the  effective  resistance  of  the
         busbars due to the skin effect, then the ax. rating will be
                                                       = 0.976 or 97.6% that of  the d.c.  rating
                                                       28.7.1  Skin effect analysis
                                   151%
                                                       When  a  number  of  flat bars  are used  in  parallel  their
                                  ~
                             128%
                      125%
                      -                                effective current-carrying  capacity  is  the  result  of  the
                118%
                -                                      cumulative effect of  the restricted heat dissipation  and
          100%
          -                                            the  increased  content  of  the  skin  effect. A  stage may
                                                       arise when  further addition of  any  more bars  may  not
                                                       appreciably increase the overall current-carrying capacity
                                                       of  such  a  system.  Referring  to  Tables  30.2,  30.4  and
                                                       30.5,  we  can  observe  a  wide  variation  in  the  current-
                                                       carrying capacity of a conductor when it is added to an
                                  --                   existing system of one, two or three conductors per phase,
           1111  II II  0  LA                          depending upon the thickness and width of the conductors.
                                                       Thinner sections of  shorter widths provide better metal
                                                       utilization, compared to a thicker section and larger widths.
            1     2     3     4     5     6      7     Use of bars up to four sections per phase is quite common
                                                       for higher  current  systems (2500 A-3200  A).  For still
         Figure 28.14  Ratio of  ax. current  ratings for different
         configurations of  busbars of the same cross-sectional area   higher  current  ratings,  use  of  more  than  four  bars  in
         (Courtesy: The Copper Development Association,  U.K.)   parallel is not advisable due to an extremely low utilization
   921   922   923   924   925   926   927   928   929   930   931