
Page 931 - Industrial Power Engineering and Applications Handbook
P. 931
Carrying power through metal-enclosed bus systems 28/881
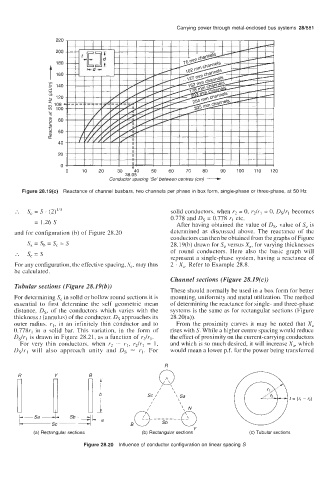
Figure 28.19(c) Reactance of channel busbars, two channels per phase in box form, single-phase or three-phase, at 50 Hz
.-. S, = s . (21113 solid conductors, when r2 = 0, r2/r1 = 0, Dslrl becomes
0.778 and Ds = 0.778 rl etc.
= 1.26 S After having obtained the value of Ds, value of S, is
and for configuration (b) of Figure 28.20 determined as discussed above. The reactance of the
conductors can then be obtained from the graphs of Figure
sa = s, = s, = s 28.19(b) drawn for S, versus X,, for varying thicknesses
:. s, = s of round conductors. Here also the basic graph will
represent a single-phase system, having a reactance of
For any configuration, the effective spacing, S,, may thus 2 . X,. Refer to Example 28.8.
be calculated.
Channel sections (Figure 28.19(c))
Tubular sections (Figure 28.19(b))
These should normally be used in a box form for better
For determining S, in solid or hollow round sections it is mounting, uniformity and metal utilization. The method
essential to first determine the self geometric mean of determining the reactance for single- and three-phase
distance, Ds, of the conductors which varies with the systems is the same as for rectangular sections (Figure
thickness t (annulus) of the conductor. Ds approaches its 28.20(a)).
outer radius, rl, in an infinitely thin conductor and to From the proximity curves it may be noted that X,
0.778r1 in a solid bar. This variation, in the form of rises with S. While a higher centre spacing would reduce
Dslrl is drawn in Figure 28.21, as a function of r2/rl. the effect of proximity on the current-carrying conductors
For very thin conductors, when r2 = rl, r2/r1 = 1, and which is so much desired, it will increase X,, which
Dslrl will also approach unity and Ds = rl. For would mean a lower p.f. for the power being transferred
R
0
R Y B
/
I \ \
sc / \ Sa
/
/ \
1
(a) Rectangular sections (b) Rectangular sections (c) Tubular sections
Figure 28.20 Influence of conductor configuration on linear spacing S