
Page 929 - Industrial Power Engineering and Applications Handbook
P. 929
Carrying power through metal-enclosed bus systems 28/879
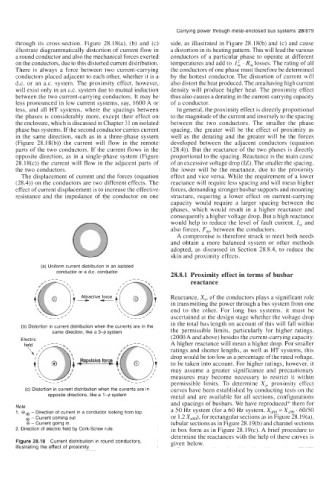
through its cross-section. Figure 28.18(a), (b) and (c) side, as illustrated in Figure 28.18(b) and (c) and cause
illustrate diagrammatically distortion of current flow in a distortion in its heating pattern. This will lead the various
a round conductor and also the mechanical forces exerted conductors of a particular phase to operate at different
on the conductors, due to this distorted current distribution. temperatures and add to Z:c . R, losses. The rating of all
There is always a force between two current-carrying the conductors of one phase must therefore be determined
conductors placed adjacent to each other, whether it is a by the hottest conductor. The distortion of current will
d.c. or an a.c. system. The proximity effect, however, also distort the heat produced. The area having high current
will exist only in an a.c. system due to mutual induction density will produce higher heat. The proximity effect
between the two current-carrying conductors. It may be thus also causes a derating in the current-cawing capacity
less pronounced in low current systems, say, 1600 A or of a conductor.
less, and all HT systems, where the spacings between In general, the proximity effect is directly proportional
the phases is considerably more, except their effect on to the magnitude of the current and inversely to the spacing
the enclosure, which is discussed in Chapter 3 1 on isolated between the two conductors. The smaller the phase
phase bus systems. If the second conductor carries current spacing, the greater will be the effect of proximity as
in the same direction, such as in a three-phase system well as the derating and the greater will be the forces
(Figure 28.18(b)) the current will flow in the remote developed between the adjacent conductors (equation
parts of the two conductors. If the current flows in the (28.4)). But the reactance of the two phases is directly
opposite direction, as in a single-phase system (Figure proportional to the spacing. Reactance is the main cause
28.18(c)) the current will flow in the adjacent parts of of an excessive voltage drop (IZ). The smaller the spacing,
the two conductors. the lower will be the reactance, due to the proximity
The displacement of current and the forces (equation effect and vice versa. While the requirement of a lower
(28.4)) on the conductors are two different effects. The reactance will require less spacing and will mean higher
effect of current displacement is to increase the effective forces, demanding stronger busbar supports and mounting
resistance and the impedance of the conductor on one structure, requiring a lower effect on current-carrying
capacity would require a larger spacing between the
phases, which would result in a higher reactance and
consequently a higher voltage drop. But a high reactance
would help to reduce the level of fault current, I,, and
also forces, Fm, between the conductors.
A compromise is therefore struck to meet both needs
and obtain a more balanced system or other methods
adopted, as discussed in Section 28.8.4, to reduce the
skin and proximity effects.
(a) Uniform current distribution in an isolated
conductor or a d.c. conductor 28.8.1 Proximity effect in terms of busbar
--
c--. reactance
Reactance, X,, of the conductors plays a significant role
Attractive force
in transmitting the power through a bus system from one
end to the other. For long bus systems, it must be
'-_-' ascertained at the design stage whether the voltage drop
in the total bus length on account of this will fall within
(b) Distortion in current distribution when the currents are in the
same direction, like a 3-$ system the permissible limits, particularly for higher ratings,
Electric (2000 A and above) besides the current-carrying capacity.
A higher reactance will mean a higher drop. For smaller
ratings and shorter lengths, as well as HT systems, this
drop would be too low as a percentage of the rated voltage,
to be taken into account. For higher ratings, however, it
may assume a greater significance and precautionary
measures may become necessary to restrict it within
permissible limits. To determine X,, proximity effect
(c) Distortion in current distribution when the currents are in curves have been established by conducting tests on the
opposite directions, like a 1-4 system metal and are available for all sections, configurations
and spacings of busbars. We have reproduced* them for
Note a 50 Hz system (for a 60 Hz system, Xa60 = Xaso . 60150
1. 8 - Direction of current in a conductor looking from top.
- Current coming out or 1.2 Xaso), for rectangular sections as in Figure 28.19(a),
6 - Current going in. tubular sections as in Figure 28.19(b) and channel sections
2. Direction of electric field by Cork-Screw rule. in box form as in Figure 28.19(c). A brief procedure to
determine the reactances with the help of these curves is
Figure 28.18 Current distribution in round conductors, given below.
illustrating the effect of proximity