Page 424 - Industrial Wastewater Treatment, Recycling and Reuse
P. 424

396   Industrial Wastewater Treatment, Recycling, and Reuse


          performance for COD reduction, turbidity, power consumption, and other
          performance parameters. Submerged module testing was done with simulated
          water in the lab. Simulated wastewater prepared showed 850 mg/L COD and
          359 mg/L BOD as given in Table 9.10. Simulated wastewater was fed into the
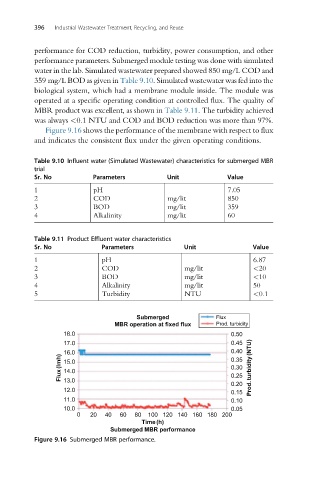
          biological system, which had a membrane module inside. The module was
          operated at a specific operating condition at controlled flux. The quality of
          MBR product was excellent, as shown in Table 9.11. The turbidity achieved
          was always <0.1 NTU and COD and BOD reduction was more than 97%.
             Figure 9.16 shows the performance of the membrane with respect to flux
          and indicates the consistent flux under the given operating conditions.


          Table 9.10 Influent water (Simulated Wastewater) characteristics for submerged MBR
          trial
          Sr. No          Parameters          Unit            Value

          1               pH                                   7.05
          2               COD                 mg/lit           850
          3               BOD                 mg/lit           359
          4               Alkalinity          mg/lit           60


          Table 9.11 Product Effluent water characteristics
          Sr. No            Parameters             Unit              Value
          1                  pH                                      6.87
          2                  COD                   mg/lit            <20
          3                  BOD                   mg/lit            <10
          4                  Alkalinity            mg/lit            50
          5                  Turbidity             NTU               <0.1


                                      Submerged            Flux
                                MBR operation at fixed flux  Prod. turbidity
                  18.0                                         0.50
                  17.0                                         0.45
                                                               0.40
                 Flux(lmh) 16.0                                0.35  Prod. turbidity(NTU)
                  15.0
                                                               0.30
                  14.0
                                                               0.25
                  13.0
                                                               0.20
                  12.0
                                                               0.15
                  11.0                                         0.10
                  10.0                                         0.05
                      0  20  40  60  80  100 120 140 160 180 200
                                       Time (h)
                               Submerged MBR performance
          Figure 9.16 Submerged MBR performance.
   419   420   421   422   423   424   425   426   427   428   429