
Page 142 - Innovations in Intelligent Machines
P. 142
Evolution-based Dynamic Path Planning for Autonomous Vehicles 133
4 step = 0 4 step = 15
time = 0 time = 0
3.5 3.5
3 3 1
Latitude (deg) 2.5 2 1 Latitude (deg) 2.5 2 1 1
1.5
1.5
1 1 1
0.5 0.5
0 0
10 10.5 11 11.5 12 12.5 13 13.5 14 14.5 15 10 10.5 11 11.5 12 12.5 13 13.5 14 14.5 15
Longitude (deg) Longitude (deg)
(a) (b)
4 step = 30 4 step = 40
time = 0 time = 0
3.5 3.5
3 1 3 1
Latitude (deg) 2.5 2 1 1 Latitude (deg) 2.5 2 1 1
1.5
1.5
1 1 1 1
0.5 0.5
0 0
10 10.5 11 11.5 12 12.5 13 13.5 14 14.5 15 10 10.5 11 11.5 12 12.5 13 13.5 14 14.5 15
Longitude (deg) Longitude (deg)
(c) (d)
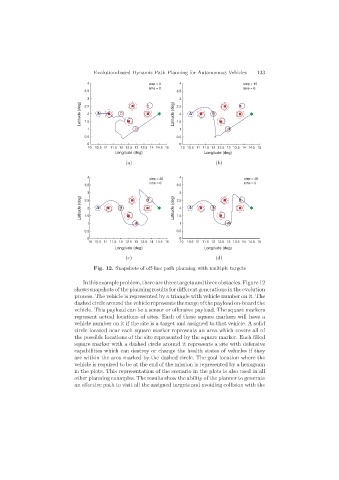
Fig. 12. Snapshots of off-line path planning with multiple targets
Inthisexampleproblem,therearethreetargetsandthreeobstacles.Figure 12
shows snapshots of the planning results for different generations in the evolution
process. The vehicle is represented by a triangle with vehicle number on it. The
dashed circle around the vehicle represents the range of the payload on-board the
vehicle. This payload can be a sensor or offensive payload. The square markers
represent actual locations of sites. Each of these square markers will have a
vehicle number on it if the site is a target and assigned to that vehicle. A solid
circle located near each square marker represents an area which covers all of
the possible locations of the site represented by the square marker. Each filled
square marker with a dashed circle around it represents a site with defensive
capabilities which can destroy or change the health states of vehicles if they
are within the area marked by the dashed circle. The goal location where the
vehicle is required to be at the end of the mission is represented by a hexagram
in the plots. This representation of the scenario in the plots is also used in all
other planning examples. The results show the ability of the planner to generate
an effective path to visit all the assigned targets and avoiding collision with the