Page 146 - Innovations in Intelligent Machines
P. 146

Evolution-based Dynamic Path Planning for Autonomous Vehicles  137
                           a smaller task score. The profiles of score weighting functions of both tasks
                           are given in Figure 16. Figure 17 and 18 show the results of an off-line path
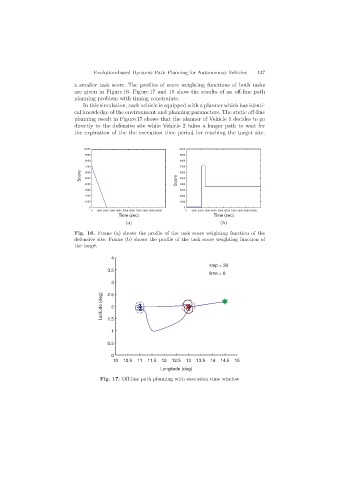
                           planning problem with timing constraints.
                              In this simulation, each vehicle is equipped with a planner which has identi-
                           cal knowledge of the environment and planning parameters. The static off-line
                           planning result in Figure 17 shows that the planner of Vehicle 1 decides to go
                           directly to the defensive site while Vehicle 2 takes a longer path to wait for
                           the expiration of the the execution time period for reaching the target site.

                              10000                             10000
                               9000                             9000
                               8000                             8000
                               7000                             7000
                             Score  6000                        6000
                                                                5000
                               5000
                               4000                            Score  4000
                               3000                             3000
                               2000                             2000
                               1000                             1000
                                0                                 0
                                 0  1000 2000 3000 4000 5000 6000 7000 8000 9000 10000  0  1000 2000 3000 4000 5000 6000 7000 8000 9000 10000
                                           Time (sec)                       Time (sec)
                                             (a)                              (b)

                           Fig. 16. Frame (a) shows the profile of the task score weighting function of the
                           defensive site. Frame (b) shows the profile of the task score weighting function of
                           the target

                                        4
                                                                           step = 30
                                       3.5
                                                                          time = 0
                                        3
                                     Latitude (deg)  2.5 2  1      1 2

                                                  2

                                       1.5
                                        1

                                       0.5

                                        0
                                         10  10.5  11  11.5  12  12.5  13  13.5  14  14.5  15
                                                         Longitude (deg)

                                    Fig. 17. Off-line path planning with execution time window
   141   142   143   144   145   146   147   148   149   150   151