
Page 212 - Instrumentation Reference Book 3E
P. 212
196 Fiber optics in sensor instrumentation
5 x 10-"nm was reported, giving a fractional to strip off the fiber coating and then to replace it
bandwidth of about Several methods have after exposure; this will weaken the mechanical
been reported to increase further the reflectivity strength of the fibers.
of the gratings, with index changes up to lo-' The second feature is that Type I1 grating
being observed with techniques such as boron structures exhibit the property of surviving with-
co-doping and dehydrogenation of the fiber to out signs of annealing up to temperatures of
increase its photosensitivity. 800 "C and are only removed after being held at
Gratings have also been successfully produced temperatures of 1000 "C. In Type 1 gratings, tem-
using pulsed laser sources such as excimer lasers peratures above 450 "C anneal the photorefrac-
having a pulse duration of approximately 20ns tive grating structure within seconds. Therefore,
(Askins et al. 1992; Archambault et al. 1993). it is possible to consider Type I1 fiber gratings for
Subsequent work (Archambault et al. 1993b) has use in harsh environments, especially where high
shown that there are two basic types of possible temperatures are encountered (e.g., process con-
grating structures: Type I and Type I1 formed in trol, high temperature piping such as power gen-
the low and high pulse energy regimes, respec- eration, and aeronautical engine monitoring
tively. Pulse energies below about 20 mJ were applications).
shown to generate Type I gratings in a similar The availability of the technology to produce
way to the method using continuous wave in-fiber grating structures has permitted their use
sources having a narrow spectral bandwidth and in a number of sensing applications, including
moderate modulation depths up to about 75 temperature sensing (Morey et al. 1989), strain
percent. For pulse energies above 40mJ Type I1 monitoring (Kersey et al. 1992), and high pressure
gratings were formed, having very high reflectivi- sensing (Xu et al. 1993). The parameter measured
ties (approaching 100 percent) and with a much in each case is the spectral change AXB~~~~ in the
~
~
broader fractional bandwidth (about 6 x central Bragg wavelength X B of ~the grating ~
In these Type 11 gratings a structural transform- structure. In temperature sensing applications
ation occurs at the cladding-core interface on one (Morey etal. 1989), the fractional change in the
side of the fiber. with the result that below the Bragg wavelength is given by the expression:
Bragg wavelength light is coupled strongly to the
cladding, while above the Bragg spectral band- AXBragg - (a + <)AT (12.55)
--
width light is transmitted in the fiber core. XBragg
Two significant features are evident for the use
of the pulsed laser grating method. The first is where a is the thermal expansion coefficient and E
that there is sufficient energy per pulse to allow a is the thermo-optic coefficient. The latter is the
single shot formation of the grating structure. dominant fiber effect, and wavelength shifts of
This feature permits the production of the grat- 0.006 nm/ "C have been reported at a wavelength
ings in a fiber as it emerges from the fiber drawing of 550 nm.
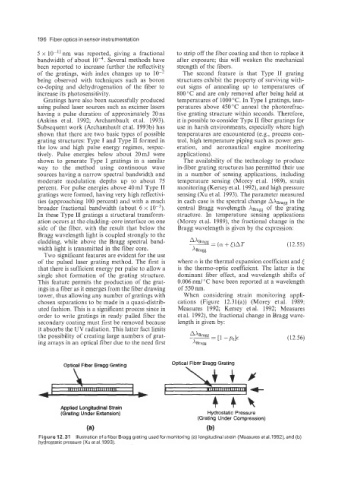
tower. thus allowing any number of gratings with When considering strain monitoring appli-
chosen separations to be made in a quasi-distrib- cations (Figure 12.31(a)) (Morey et al. 1989;
uted fashion. This is a significant process since in Measures 1992; Kersey et al. 1992; Measures
order to write gratings in ready pulled fiber the et al. 1991), the fractional change in Bragg wave-
secondary coating must first be removed because length is given by:
it absorbs the UV radiation. This latter fact limits
the possibility of creating large numbers of grat- (12.56)
ing arrays in an optical fiber due to the need first
Optical Fiber Bragg Grating Optical Fiber Bragg Grating
\ \7$F
L
I 1r~r-m I +
44h
Applied Longitudinal Strain
(Grating Under Extension) Hydrostatic Pressure
(Grating Under Compression)
(a) (b)
Figure 12.31 Illustration ofa fiber Bragg grating used for monitoring (a) longitudinal strain (Measures et al.1992). and (b)
hydrostatic pressure (Xu et al. 1993).