
Page 210 - Instrumentation Reference Book 3E
P. 210
194 Fiber optics in sensor instrumentation
where Q is related to the cavity length L, its
refractive index n and optical wavelength X by:
4mL (12.50)
$=- (12.48)
x
In its use with optical fibers, the cavity is formed where the last term is associated with the effect of
in a short length (1-30mm) of optical fiber that wavelength changes in the source radiation and
has partially reflecting coated ends (both alumin- can be ignored if the source wavelength fluctu-
um and Ti02 have been used (Lee et al. 1989)), ation is small or negligible. The change in refract-
which is then fusion spliced onto the end of the ive index (dn/dT) dominates the phase change at
connecting fiber (Figure 12.28). For example, temperatures above about 20 "C since the thermal
with lOOnm deposited Ti02 layers. after fusing expansion (dUdT) of the fiber length is an order
and splicing a 1 mm Fabry-Perot fiber cavity into of magnitude lower for a silica optical fiber and
a fiber length, 2 percent reflectivity was reported where the temperature dependence of the refract-
for the fused fiber cavity mirrors. This arrange- ive index associated phase change is about
ment provides a low finesse cavity with mirror 100 rad/ "C. However, at lower temperatures
reflectivities of about 10 percent or less. Under (<20 "C) the temperature coefficient of the refrac-
these conditions the Fabry-Perot cavity acts tive index is low and the fiber contracts with
essentially as a two-beam interferometer. since decreasing temperature (negative value of ther-
multiple reflections in the cavity are weak and mal expansion), resulting in a more nonlinear
the transfer function for the optical phase differ- optical path length change with temperature. In
ence Q of the back-reflected intensity I, has the high temperature sensor applications using a
cosine fringe form: novel pulsed modulation technique over a tem-
IT = &[I + vcosd] (12.49) perature range of 1225°C (-200°C to 1050°C),
Lee et al. (1988) found a 1 mm fiber cavity length to
where I, is the mean return intensity, and v is the give a fringe extinction ratio of 20:l.
fringe visibility (51). It is possible to detect Pressure effects have also been monitored using
changes in the optical phase difference of the the fiber Fabry-Perot sensor where a 30cm dia-
interferometer output by using interferometric meter coil was compressed between two metal
techniques such as the single mode laser diode plates (Yoshimo et al. 1982) and a sensitivity of
pseudo-heterodyne method or the broad-band, 0.04 rad/Pa/m was reported.
white-light interferometric approach. In the for- Similarly, longitudinal strain (the ratio of the
mer (Kist etal. 1985), the output wavelength of fiber extension AL to its original length L) can
the laser diode is ramped by applying serrodyne also be monitored through observation of the
input current ramp which modulates its output induced phase changes in the fiber interferometer
frequency Af by about 3GHz/mA, where fre- output (Measures 1992). In this case it is the
quency modulations of 10-100 GHz are possible. strain-optic coefficient (e = AL/L) that is of
The back-reflected radiation from the Fabry- interest. Under the condition that zero strain is
Perot cavity has a periodic sine wave form as coupled to the fiber in directions other than along
described previously. Alternatively, the white- the longitudinal axis, i.e., a uniaxial stress load-
light technique (Lee and Taylor 1991) can be used ing, the corresponding phase change is given by:
as described earlier. Either way, the change in the
phase of the output fringe pattern can be mon- 47rn L
itored and related to the measurand of interest. A$& = ~
For temperature measurement, the change in x
phase has the form: (12.51)
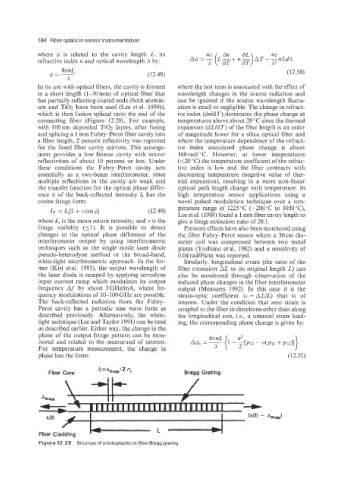
A= hBrage 12.4
Fiber Core Bragg Grating
&a,,)
Figure 12.29 Structure of a holographic in-fiber Bragg grating.