
Page 205 - Instrumentation Reference Book 3E
P. 205
Doppler anemometry 189
The second beam from PBSI is allowed to pass where I1 and I2 are the output photodiode cur-
through the polarizing beam splitter (PBSZ) rents, b' is the interface mixing efficiency, and &,
oriented along the light polarizing axis and, with is the static interferometer phase imbal- ance.
the aid of the focusing objective lens, is launched The presence of the carrier signalf~ allows the
into one polarization axis of the polarization direction of the motion of the vibrating surface
maintaining optical fiber. It is then transmitted to be determined unambiguous1 . Since the beat
through the optical fiber in this polarization frequency is proportional to & it is possible
mode to the fiber end where it is focused on the to improve the detection of the weak Doppler
vibrating target surface by a second lens element. signal Zl by increasing the intensity of the refer-
The light is then reflected or scattered from this ence beam 11. There is a fundamental limit to
surface and relaunched back into the optical which the output signal is can be increased rela-
fiber. The presence of the quarter wave plate at tive to the noise component i,, which is related to
the fiber end ensures that the polarization axis of the quantum detection limit of the photodetector
the light is rotated through 90" such that when it given by:
is launched back into the fiber it propagates back
down the fiber in the orthogonal polarization
mode. (12.32)
When ithis light emerges at the other fiber end it
is collimated by the focusing objective and then where 17 is the quantum efficiency of the detector.
reflected through 90" by the polarizing beam 4f is the pass band of the detector and preampli-
splitter (PBS2). The light then passes to the final fier electronics, hv is the light quantum and 12 is
beam splitter (BS3) and its output is divided the weak Doppler signal.
between the two photodetectors along with the The output signal is demodulated by a phase-
radiation that has passed through the Bragg cell lock loop (PLL) that produces an error signal pro-
arm. The two component beams falling on each portional to the surface velocity v,(t). The PPL
photodetector have traversed different paths in can respond to, typically, 420 percent of the
the Mach-Zehnder interferometer and therefore carrier signal while still maintaining good linear-
have different frequencies and phases but the ity along with a wide frequency response. The
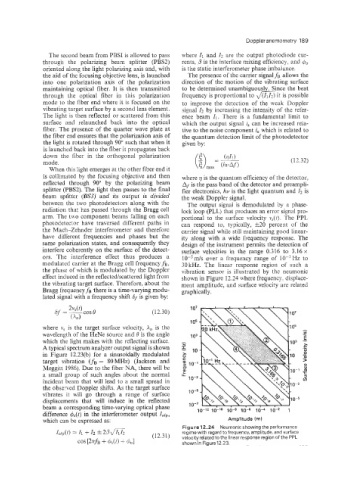
same polarization states, and consequently they design of the instrument permits the detection of
interfere coherently on the surface of the detect- surface velocities in the range 0.316 to 3.16 x
ors. The interference effect thus produces a lO-jm/s over a frequency range of lO-'Hz to
modulated carrier at the Bragg cell frequency fB, 30kHz. The linear response region of such a
the phase of which is modulated by the Doppler vibration sensor is illustrated by the neumonic
effect induced in the reflectedlscattered light from shown in Figure 12.24 where frequency. displace-
the vibrating target surface. Therefore, about the ment amplitude, and surface velocity are related
Bragg frequency fB there is a time-varying modu- graphically.
lated signal with a frequency shift 6, is given by:
107
(1 2.30)
105
where v, is the target surface velocity, A, is the
wavelength of the HeNe source and 0 is the angle 103
which the light makes with the reflecting surface. -
N
A typical spectrum analyzer output signal is shown z 10
in Figure 12.23(b) for a sinusoidally modulated E
target vibration cf~ = SOMHz) (Jackson and E
m
3 10-1
Meggitt 1986). Due to the fiber NA, there will be 0
E
a small group of such angles about the normal LL
incident beam that will lead to a small spread in 10-3
the observed Doppler shifts. As the target surface
vibrates it will go through a range of surface 10-5
displacements that will induce in the reflected
beam a corresponding time-varying optical phase 10-7 10-4 io-*
difference &(t) in the interferometer output lo/p, 10-12 10-l~ IO-* 10-6 1
which can be expressed as: Amplitude (m)
Figure 12.24 Neumonic showing the performance
Ioloip(t) = I1 + 12 2,om (12.31) regime with regard to frequency, amplitude, and surface
cos [2TfB + 6s(f> + 401 velocity related to the linear response region of the PPL
shown in Figure12.23.