
Page 203 - Instrumentation Reference Book 3E
P. 203
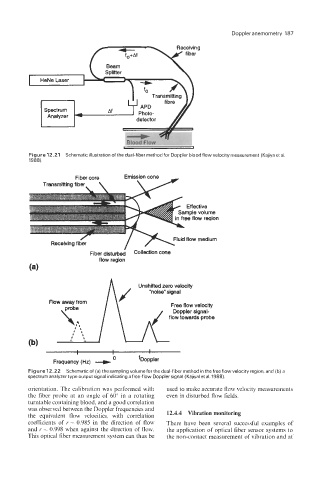
Doppler anemometry 187


                            I    Beam               \


                                        1   lo  Transm'itting \ /


                                       I
                                       E
                                      1                   1
          Figure 12.21  Schematic illustration of the dual-fiber method for Doppler blood flow velocity measurement (Kajiya et al.
          1988).

                        Fiber core    Emission cone
              Transmitting fiber,   \     \/


                                      /
                                                             M
                         /.                 ~     I    u  fbw medium
                Receiving fiber
                            Fiber disturbed     cone
                               flow region


                                          Unshfted  zero vebcity
                                              "noise" signal
                   <:                              flow towards probe
                Fbw away from                       Free flow velocity
                                                     Doppler signal-


                       I  4 nt  % 8
                       #  t
                      #   8
                 Frequency (Hz) +
                                   0
          Figure 12.22  Schematic of (a) the sampling volume for the dual-fiber method in the free flow velocity region, and (b) a
         spectrum analyzer type output signal indicating a free-flow Doppler signal (Kajiyal et al. 1988).

          orientation. The calibration  was performed with   used to make accurate flow velocity measurements
          the fiber probe  at an angle of 60"  in  a  rotating   even in disturbed flow fields.
         turntable containing blood, and a good correlation
         was observed between the Doppler frequencies and
         the  equivalent  flow  velocities,  with  correlation   12'4*4  Vibration monitoring
         coefficients of  r = 0.985 in  the direction of  flow   There  have  been  several successful examples of
          and r  = 0.998 when against the direction of flow.   the application of optical fiber sensor systems to
         This optical fiber measurement system can thus be   the non-contact measurement of vibration and at