
Page 202 - Instrumentation Reference Book 3E
P. 202
186 Fiber optics in sensor instrumentation
Power spectrum-
Power spectrum-
L
Free flow
Free flow
velgcity
Noise spectrum-
zero flow . I
Frequency (kHz) "free flow
Figure 12.1 9 Illustration of a typical FODA output power spectrum for liquid flow measurement, showing free flow velocity
(Kilpatrick et at. 1982).
Flow velocity
Profile
- ------
Mean
P velocity
I
0' 1.5
Distance from vessel wall (mm)
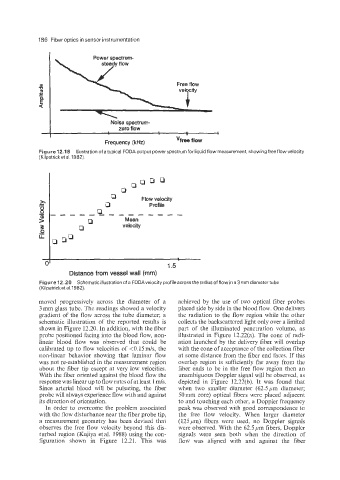
Figure 12.20 Schematic illustration of a FODAvelocity profile across the radius of flow in a 3 mm diameter tube
(Kilpatricket a1.1982).
moved progressively across the diameter of a achieved by the use of two optical fiber probes
3 mm glass tube. The readings showed a velocity placed side by side in the blood flow. One delivers
gradient of the flow across the tube diameter; a the radiation to the flow region while the other
schematic illustration of the reported results is collects the backscattered light only over a limited
shown in Figure 12.20. In addition, with the fiber part of the illuminated penetration volume, as
probe positioned facing into the blood flow, non- illustrated in Figure 12.22(a). The cone of radi-
linear blood flow was observed that could be ation launched by the delivery fiber will overlap
calibrated up to flow velocities of <O. 15 m/s, the with the cone of acceptance of the collection fiber
non-linear behavior showing that laminar flow at some distance from the fiber end faces. If this
was not re-established in the measurement region overlap region is sufficiently far away from the
about the fiber tip except at very low velocities. fiber ends to be in the free flow region then an
With the fiber oriented against the blood flow the unambiguous Doppler signal will be observed, as
response was linear up to flow rates of at least 1 ds. depicted in Figure 12.22(b). It was found that
Since arterial blood will be pulsating, the fiber when two smaller diameter (62.5 pm diameter;
probe will always experience flow with and against 50mm core) optical fibers were placed adjacent
its direction of orientation. to and touching each other, a Doppler frequency
In order to overcome the problem associated peak was observed with good correspondence to
with the flow disturbance near the fiber probe tip, the free flow velocity. When larger diameter
a measurement geometry has been devised that (125pm) fibers were used, no Doppler signals
observes the free flow velocity beyond this dis- were observed. With the 62.5 pm fibers, Doppler
turbed region (Kajiya et al. 1988) using the con- signals were seen both when the direction of
figuration shown in Figure 12.21. This was flow was aligned with and against the fiber