
Page 200 - Instrumentation Reference Book 3E
P. 200
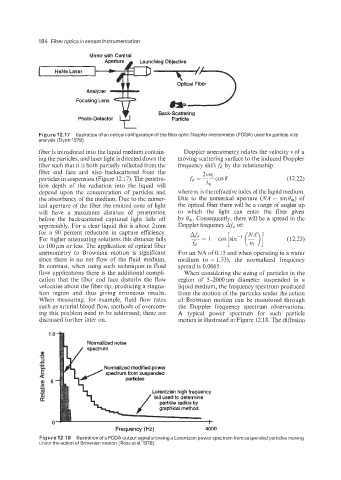
184  Fiber optics in sensor instrumentation   --

                            Mirror with Central
                                Ap;rtp          ing Objec;   /,/,   ~
             I   HeNe Laser

                                                      Optical Fiber
                           Analyzer
                        Focusing Lens
                                                Back-Scattering
                        Photo-Detector              Particle
             Figure 12.17  Illustration of an optical configuration of the fiber optic Doppleranemometer (FODA) used for particle-size
             analysis (Dyott 1978).
             fiber is introduced into the liquid medium contain-   Doppler anemometry relates the velocity v of a
             ing the particles, and laser light is directed down the   moving scattering surface to the induced Doppler
             fiber such that it is both partially reflected from the   frequency shift  fd  by the relationship:
             fiber  elid  face  and  also  backscattered  from  the   2 v7z 1
             particles in suspension (Figure 12.17). The penetra-   fa = --cos0       (1 2.22)
             tion  depth  of  the  radiation  into  the  liquid  will   A3
             depend  upon  the  concentration  of  particles  and   where 121  is the refractive index of the liquid medium.
             the absorbency of the mediuni. Due to the numer-   Due to  the  numerical aperture  (NA = sin&,)  of
             ical aperture of the fiber the emitted cone of light   the optical fiber there will be a range of angles up
             will  have  a  maximum  distance  of  penetration   to  which  the  light  can  enter  the  fiber  given
             before  the  backscattered  captured  light  falls  off   by 0,.  Consequently, there will be a spread in the
             appreciably. For a clear liquid this is about 2mm   Doppler frequency Afd of:
             for  a  90  percent reduction  in  capture efficiency.
             For higher attenuating solutions this distance falls   ~ Afd  = 1 - cos [sin-' (e)]  (12.23)
             to 100  pm or less. The application of optical fiber   .fd
             anemometry  to  Brownian  motion  is  significant   For an NA of 0.15 and when operating in a water
             since there is no net  flow  of  the fluid  medium.   medium  (n = 1.33),  the  normalized  frequency
             In contrast, when using such techniques in fluid   spread is 0.0065.
             flow applications there is the additional compli-   When considering the sizing of particles in the
             cation  that  the  fiber  end  face disturbs  the  flow   region  of  5-2000nm  diameter  suspended  in  a
             velocities about the fiber tip, producing a stagna-   liquid medium, the frequency spectrum produced
             tion  region  and  thus  giving  erroneous  results.   from the motion of the particles under the action
             When  measuring,  for  example,  fluid  flow  rates   of Brownian  motion  can  be  monitored  through
             such as arterial blood flow, methods of overcom-   the  Doppler  frequency  spectrum  observations.
             ing this problem need to be addressed; these are   A  typical  power  spectrum  for  such  particle
             discussed further later on.              motion is illustrated in Figure 12.18. The diffusion
                1 .o
                           Normalized noise


                                Normalized moddied power
                                spectrum from suspended
                5
                                              Lorentzian high frequency
                                               tail used to determine
                                                 particle radius by
                                                graphical method

                 V  '                                          I
                                   Frequency (Hz)             4000
             Figure 12.18  Illustration of a FODA output signal showing a Lorentzian power spectrum from suspended particles moving
             under the action of  Brownian motion (Ross et al. 1978).