
Page 195 - Instrumentation Reference Book 3E
P. 195
Interferometric sensing approach 179
pressure liaving a least mean square fit of
26.932 MPa - 1.02082 kPa/Hz xfvc0,adeviation
of 0.1 percent of full scale (3.4 kPa), and a short-
term noise stability of about 3kPa peak to T
peak. Reversible thermal effects were evident in
the sensing and reference cavities. and at P = 0
these were reported as 1 kPa/"C and 12 kPa/"C.
respectively.
12.3.3.3 Electronical[i~ scaiined method
More recently, a second white-light sensing i
method has been established that eliminates the
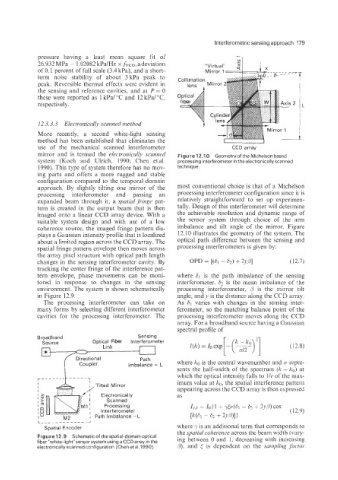
use of the mechanical scanned interferometer CCD array
mirror an'd is termed the electronic all^^ scaniied Figure 12.10 Geometryof the Michelson based
system (Koch and Ulrich, 1990; Chen etal. processing interferometer in the electronically scanned
1990). This type of system therefore has no mov- technique.
ing parts and offers a more rugged and stable
configuration compared to the temporal domain
approach. By slightly tilting one mirror of the most conventional choice is that of a Michelson
processing interferometer and passing an processing interferometer configuration since it is
expanded beam through it, a spatial ji-inge pat- relatively straightforward to set up experimen-
tern is created in the output beam that is then tally. Design of this interferometer will determine
imaged onto a linear CCD array device. With a the achievable resolution and dynamic range of
suitable system design and with use of a low the sensor system through choice of the arm
coherence source, the imaged fringe pattern dis- imbalance and tilt angle of the mirror. Figure
plays a Gaussian intensity profile that is localized 12.10 illustrates the geometry of the system. The
about a limited region across the CCD array. The optical path difference between the sensing and
spatial fringe pattern envelope then moves across processing interferometers is given by:
the array ]pixel structure with optical path length
changes in the sensing interferometer cavity. By
tracking the center fringe of the interference pat-
tern envelope, phase movements can be moni- where 61 is the path imbalance of the sensing
tored in response to changes in the sensing interferometer. 6, is the mean imbalance of $he
environment. The system is shown schematically processing interferometer, ,0 is the mirror tilt
in Figure 12.9. angle, and y is the distance along the CCD array.
The processing interferometer can take on As 61 varies with changes in the sensing inter-
many forrns by selecting different interferometer ferometer, so the matching balance point of the
cavities for the processing interferometer. The processing interferometer moves along the CCD
array. For a broadband source having a Gaussian
spectral profile of
Broadband Sensing
Source 0 ptica I Fiber Interferometer
(12.8)
where ko is the central wavenumber and CT repre-
sents the half-width of the spectrum (k - ko) at
which the optical intensity falls to l/r of the max-
imum value at ko, the spatial interference pattern
appearing across the CCD array is then expressed
as
L _-__-_-- -----J
Spatial Encoder where 7 is an additional term that corresponds to
the spatial coherence across the beam width (vary-
Figure 12.9 Schematic of the spatial-domain optical ing between 0 and 1, decreasing with increasing
fiber "white-1ight"sensor system using a CCD array in the
electronically scanned coqfiguration (Chen et ai 1990) /3), and E is dependent on the saiiipliiig factor