
Page 192 - Instrumentation Reference Book 3E
P. 192
176 Fiber ootics in sensor instrumentation
Broad-Band
Source
(Fiber Coupled)
6 Reflected Light Path Imbalance
S
(Coherence 4- Optical Sensing
Interferometer
Optical Processing
L >> IC
Interferometer Path
Imbalance within
L f I$
Electronic Decoding
Unit (a)
(b)
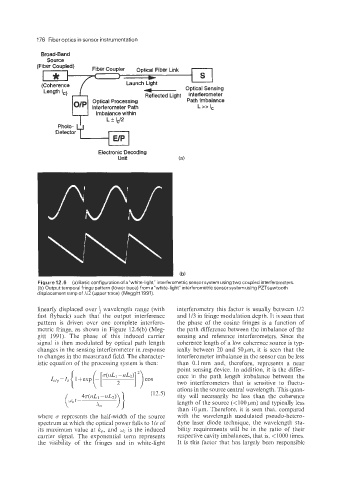
Figure 12.6 (a) Basic configuration of a"white4ght" interferometric sensor system using two coupled interferometers.
(b) Output temporal fringe pattern (lower trace) from a"white-light" interferometric sensor system using PZTsawtooth
displacement ramp of Xi2 (upper trace) (Meggitt 1991).
linearly displaced over 1 wavelength range (with interferometry this factor is usually between 1/2
fast flyback) such that the output interference and 1/3 in fringe modulation depth. It is seen that
pattern is driven over one complete interfero- the phase of the cosine fringes is a function of
metric fringe, as shown in Figure 12.6(b) (Meg- the path difference between the imbalance of the
gitt 1991). The phase of this induced carrier sensing and reference interferometers. Since the
signal is then modulated by optical path length coherence length of a low coherence source is typ-
changes in the sensing interferometer in response ically between 20 and 50pm, it is seen that the
to changes in the measurand field. The character- interferometer imbalance in the sensor can be less
istic equation of the processing system is then: than 0.1 mm and, therefore, represents a near
point sensing device. In addition, it is the differ-
ence in the path length imbalance between the
two interferometers that is sensitive to fluctu-
ations in the source central wavelength. This quan-
47r(nL, -nLz) (12.5) tity will necessarily be less than the coherence
w,t- length of the source (<100p,m) and typically less
A,
than 10pm. Therefore, it is seen that, compared
where cr represents the half-width of the source with the wavelength modulated pseudo-hetero-
spectrum at which the optical power falls to lle of dyne laser diode technique, the wavelength sta-
its maximum value at k,, and w, is the induced bility requirements will be in the ratio of their
carrier signal. The exponential term represents respective cavity imbalances, that is; < 1000 times.
the visibility of the fringes and in white-light It is this factor that has largely been responsible