
Page 199 - Instrumentation Reference Book 3E
P. 199
Doppler anemometry 183
80
-
60
3
E40
E
a
z
u)
20
0
0 20 40 60 80 100
Coherence Length (No of Fringes)
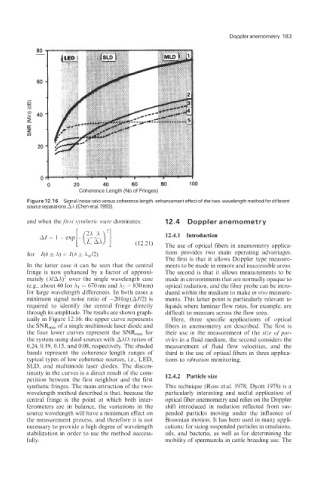
Figure 12.1 6 Signal/noise ratio versus coherence length: enhancement effect of the two-wavelength method for different
source separations AA (Chen etal.1993).
= 1 - exp [- ri A) ’1 12.4.1 Introduction
and when the.first synthetic wave dominates: 12.4 Doppler anemometry
(12.21) The use of optical fibers in anemometry applica-
for Z(6 f A) < Z(b + A,,/2) tions provides two main operating advantages.
The first is that it allows Doppler type measure-
In the latter case it can be seen that the central ments to be made in remote and inaccessible areas.
fringe is now enhanced by a factor of approxi- The second is that it allows measurements to be
mately (A/AA)’ over the single wavelength case made in environments that are normally opaque to
(e.g., about 40 for AI = 670 nm and A2 = 830 nm) optical radiation, and the fiber probe can be intro-
for large wavelength differences. In both cases a duced within the medium to make in vivo measure-
minimum signal noise ratio of -20 log (AZ/2) is ments. This latter point is particularly relevant to
required to identify the central fringe directly liquids where laminar flow rates, for example, are
through its amplitude. The results are shown graph- difficult to measure across the flow area.
ically in Figure 12.16: the upper curve represents Here, three specific applications of optical
the SNR,i, of a single multimode laser diode and fibers in anemometry are described. The first is
the four lower curves represent the SNR,i, for their use in the measurement of the size qf par-
the system using dual sources with ANA ratios of ticles in a fluid medium, the second considers the
0.24,0.19,0.15, and 0.08, respectively. The shaded measurement of fluid flow velocities, and the
bands represent the coherence length ranges of third is the use of optical fibers in three applica-
typical types of low coherence sources, Le., LED, tions to vibration monitoring.
SLD, and multimode laser diodes. The discon-
tinuity in the curves is a direct result of the com- 12.4.2 Particle size
petition between the first neighbor and the first
synthetic fringes. The main attraction of the two- This technique (Ross et al. 1978; Dyott 1978) is a
wavelength method described is that, because the particularly interesting and useful application of
central fringe is the point at which both inter- optical fiber anemometry and relies on the Doppler
ferometers are in balance, the variations in the shift introduced in radiation reflected from sus-
source wavelength will have a minimum effect on pended particles moving under the influence of
the measurement process, and therefore it is not Brownian motion. It has been used in many appli-
necessary to provide a high degree of wavelength cations: for sizing suspended particles in emulsions,
stabilization in order to use the method success- oils, and bacteria, as well as for determining the
fully. mobility of spermuzola in cattle breeding use. The