
Page 419 - Instrumentation Reference Book 3E
P. 419
402 Chemical analysis: gas analysis
However, the complexity of the chromatograms updating of the calibration may also be possible.
of typical mixtures analyzed by chromatography The simplest data-processing systems relate peak
means that this simple form of presentation is height to concentration, but it is usually better to
unsuitable for direct interpretation or display, measure peak areas, particularly for complex
and further processing is required. The data-pro- chromatograms, as this gives some automatic
cessing system of a process chromatograph must compensation for changes in peak shape caused
be able to identify the peaks in the chromatogram by adventitious changes in operating conditions.
corresponding to components of interest in the In this case the data-processing system must
sample, and it must measure a suitable parameter incorporate an integrator.
of each peak which can be related to the con-
centration of that component of the sample. In 18.4.7.1 Display of chromatographic data
addition the system should give a clear indication
of faults in the equipment. A refinement of the basic record of the complete
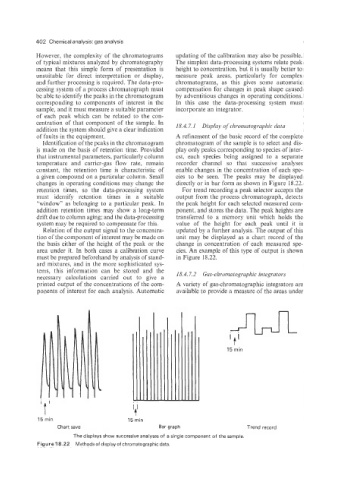
Identification of the peaks in the chromatogram chromatogram of the sample is to select and dis-
is made on the basis of retention time. Provided play only peaks corresponding to species of inter-
that instrumental parameters, particularly column est, each species being assigned to a separate
temperature and carrier-gas flow rate, remain recorder channel so that successive analyses
constant, the retention time is characteristic of enable changes in the concentration of each spe-
a given compound on a particular column. Small cies to be seen. The peaks may be displayed
changes in operating conditions may change the directly or in bar form as shown in Figure 18.22.
retention times, so the data-processing system For trend recording a peak selector accepts the
must identify retention times in a suitable output from the process chromatograph, detects
“window” as belonging to a particular peak. In the peak height for each selected measured com-
addition retention times may show a long-term ponent, and stores the data. The peak heights are
drift due to column aging: and the data-processing transferred to a memory unit which holds the
system may be required to compensate for this. value of the height for each peak until it is
Relation of the output signal to the concentra- updated by a further analysis. The output of this
tion of the component of interest may be made on unit may be displayed as a chart record of the
the basis either of the height of the peak or the change in concentration of each measured spe-
area under it. In both cases a calibration curve cies. An example of this type of output is shown
must be prepared beforehand by analysis of stand- in Figure 18.22.
ard mixtures, and in the more sophisticated sys-
tems, this information can be stored and the 18.4.7.2 Gas-chromatographic integrators
necessary calculations carried out to give a
printed output of the concentrations of the com- A variety of gas-chromatographic integrators are
ponents of interest for each analysis. Automatic available to provide a measure of the areas under
15 min
15 rnin 15 rnin
Chart save Bar graph Trend record
The displays show successive analyses of a single component of the sample.
Figure 18.22 Methodsof displayof chromatographicdata.