
Page 77 - Integrated Wireless Propagation Models
P. 77
M a c r o c e l l P r e d i c t i o n M o d e l s - P a r t 1 : A r e a - t o - A r e a M o d e l s 55
1 6 0
I
I
- - - - Manhattan Distance from
-- Hutchinson River Parkway transmitter
1 5 0 - - · New Jersey route 0 / ?
1
(/)
Qi � 1\es, /9
.0 A f./
//
·c:; v
Q) - - - -
-o 1 4 0 - ,') / /
c - / / v -.7 /).!
(/) - - - - ;/ /
(/) - - - �� 7://
..Q - - - v -/...A / / /
£ 1 3 0 _ "> -- - ,...... - / /
-
iii -u -/ /
0. / - / / / '\
LL - - / /
a: 1 2 0 0 - - . /
c - - - /
crl - - - - - .....- 1---- / /
'6 - - � Q_ /
Q)
� � .....- � / ' :>
1 1 0 � - - -
r;::r � - - - - - - - -
p- - - - - -
1 0 0
1 0 0 1 5 0 200 300 400 500 600 800 1 000 1 5 00 2000 3000 4000
Frequency in megacycles per second
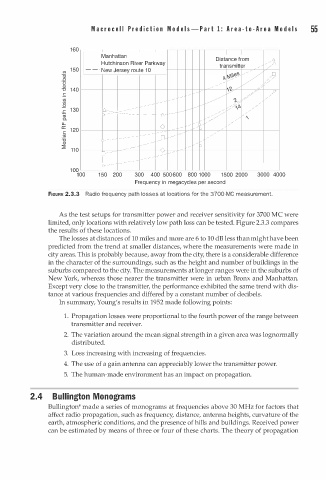
FIGURE 2.3.3 Radio frequency path losses at locations for the 3700-MC measurement.
As the test setups for transmitter power and receiver sensitivity for 3700 MC were
limited, only locations with relatively low path loss can be tested. Figure 2.3.3 compares
the results of these locations.
The losses at distances of 10 miles and more are 6 to 10 dB less than might have been
predicted from the trend at smaller distances, where the measurements were made in
city areas. This is probably because, away from the city, there is a considerable difference
in the character of the surroundings, such as the height and number of buildings in the
suburbs compared to the city. The measurements at longer ranges were in the suburbs of
New York, whereas those nearer the transmitter were in urban Bronx and Manhattan.
Except very close to the transmitter, the performance exhibited the same trend with dis
tance at various frequencies and differed by a constant number of decibels.
In summary, Young's results in 1952 made following points:
1 . Propagation losses were proportional to the fourth power of the range between
transmitter and receiver.
2. The variation around the mean signal strength in a given area was lognormally
distributed.
3. Loss increasing with increasing of frequencies.
4. The use of a gain antenna can appreciably lower the transmitter power.
5. The human-made environment has an impact on propagation.
2.4 B u l l i ngton Monograms
Bullington4 made a series of monograms at frequencies above 30 MHz for factors that
affect radio propagation, such as frequency, distance, antenna heights, curvature of the
earth, atmospheric conditions, and the presence of hills and buildings. Received power
can be estimated by means of three or four of these charts. The theory of propagation