
Page 336 - Intelligent Digital Oil And Gas Fields
P. 336
280 Intelligent Digital Oil and Gas Fields
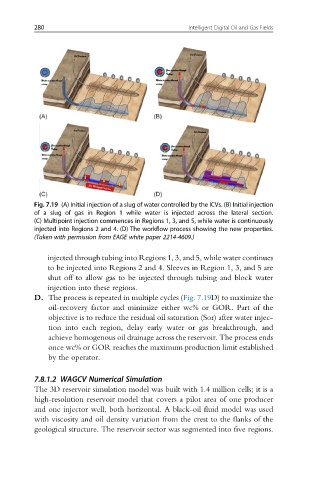
Fig. 7.19 (A) Initial injection of a slug of water controlled by the ICVs. (B) Initial injection
of a slug of gas in Region 1 while water is injected across the lateral section.
(C) Multipoint injection commences in Regions 1, 3, and 5, while water is continuously
injected into Regions 2 and 4. (D) The workflow process showing the new properties.
(Taken with permission from EAGE white paper 2214-4609.)
injected through tubing into Regions 1, 3, and 5, while water continues
to be injected into Regions 2 and 4. Sleeves in Region 1, 3, and 5 are
shut off to allow gas to be injected through tubing and block water
injection into these regions.
D. The process is repeated in multiple cycles (Fig. 7.19D) to maximize the
oil-recovery factor and minimize either wc% or GOR. Part of the
objective is to reduce the residual oil saturation (Sor) after water injec-
tion into each region, delay early water or gas breakthrough, and
achieve homogenous oil drainage across the reservoir. The process ends
once wc% or GOR reaches the maximum production limit established
by the operator.
7.8.1.2 WAGCV Numerical Simulation
The 3D reservoir simulation model was built with 1.4 million cells; it is a
high-resolution reservoir model that covers a pilot area of one producer
and one injector well, both horizontal. A black-oil fluid model was used
with viscosity and oil density variation from the crest to the flanks of the
geological structure. The reservoir sector was segmented into five regions.