
Page 337 - Intelligent Digital Oil And Gas Fields
P. 337
Smart Wells and Techniques for Reservoir Monitoring 281
For comparison with WAGCV, three processes that can help to increase res-
ervoir recovery beyond primary depletion were selected: gas injection,
water flooding, and traditional WAG.
In a separate exercise, the gas and water injection rates were optimized
to determine the best rate of injection for gas and water, while the tradi-
tional WAG was optimized by changing the slug ratio with time. The
WAG exercise showed that the best combination is 6months of injecting
water at 10,000 STB/D, followed by 6months of injecting gas at
10 MMscf/D. In WAGCV, each region was set up with an ICV that
controlled the injection rate. Oil rate and cumulative oil versus time
are displayed in Fig. 7.20.
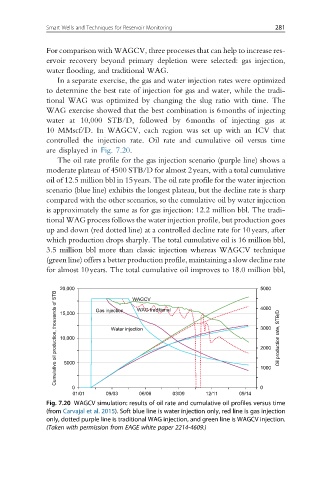
The oil rate profile for the gas injection scenario (purple line) shows a
moderate plateau of 4500 STB/D for almost 2years, with a total cumulative
oil of 12.5 million bbl in 15years. The oil rate profile for the water injection
scenario (blue line) exhibits the longest plateau, but the decline rate is sharp
compared with the other scenarios, so the cumulative oil by water injection
is approximately the same as for gas injection: 12.2 million bbl. The tradi-
tional WAG process follows the water injection profile, but production goes
up and down (red dotted line) at a controlled decline rate for 10years, after
which production drops sharply. The total cumulative oil is 16 million bbl,
3.5 million bbl more than classic injection whereas WAGCV technique
(green line) offers a better production profile, maintaining a slow decline rate
for almost 10years. The total cumulative oil improves to 18.0 million bbl,
20,000 Gas injection WAGCV 5000
Cumulative oil production, thousands of STB 10,000 Water injection 3000 Oil production rate, STB/D
4000
WAG traditional
15,000
2000
5000
0
0 1000
01/01 09/03 06/06 03/09 12/11 09/14
Fig. 7.20 WAGCV simulation: results of oil rate and cumulative oil profiles versus time
(from Carvajal et al. 2015). Soft blue line is water injection only, red line is gas injection
only, dotted purple line is traditional WAG injection, and green line is WAGCV injection.
(Taken with permission from EAGE white paper 2214-4609.)