
Page 339 - Intelligent Digital Oil And Gas Fields
P. 339
Smart Wells and Techniques for Reservoir Monitoring 283
ICV1
Seismic ICV2 ICV3
thermal ICV4
230
210
Temperature (∞C)
190
DTS
170
150
0 130
1000 150
2000 50 100
0 Time, day
Well distance, ft
Zone A Zone B Zone C Zone D
Injectivity
data x ICV 0.18 0.25
(ton/d/kPa)
0.6
0.8
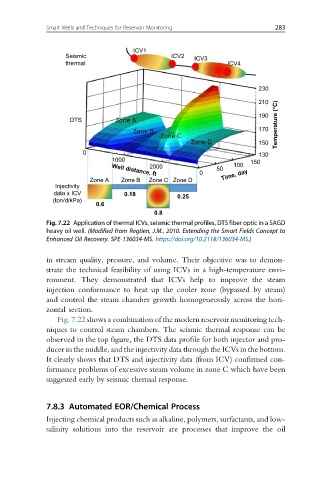
Fig. 7.22 Application of thermal ICVs, seismic thermal profiles, DTS fiber optic in a SAGD
heavy oil well. (Modified from Regtien, J.M., 2010. Extending the Smart Fields Concept to
Enhanced Oil Recovery. SPE-136034-MS. https://doi.org/10.2118/136034-MS.)
in stream quality, pressure, and volume. Their objective was to demon-
strate the technical feasibility of using ICVs in a high-temperature envi-
ronment. They demonstrated that ICVs help to improve the steam
injection conformance to heat up the cooler zone (bypassed by steam)
and control the steam chamber growth homogeneously across the hori-
zontal section.
Fig. 7.22 shows a combination of the modern reservoir monitoring tech-
niques to control steam chambers. The seismic thermal response can be
observed in the top figure, the DTS data profile for both injector and pro-
ducer in the middle, and the injectivity data through the ICVs in the bottom.
It clearly shows that DTS and injectivity data (from ICV) confirmed con-
formance problems of excessive steam volume in zone C which have been
suggested early by seismic thermal response.
7.8.3 Automated EOR/Chemical Process
Injecting chemical products such as alkaline, polymers, surfactants, and low-
salinity solutions into the reservoir are processes that improve the oil