
Page 167 - Introduction to Computational Fluid Dynamics
P. 167
P1: IWV
May 20, 2005
12:28
0521853265c05
146
0.15 CB908/Date 0 521 85326 5 2D CONVECTION – CARTESIAN GRIDS
EXPT DATA Pr = 1400
0.12
1000 0.09 Re = 21300
∗ 56000
0.06
St
88800
0.03
0.00
0.0 5.0 10 15 20 25 30
Z
0.15
PREDICTIONS Pr = 1400
0.12
1000 0.09 50000 Re = 20000
∗
0.06
St
100000
0.03
0.00
0 5 10 15 20 25 30
Z
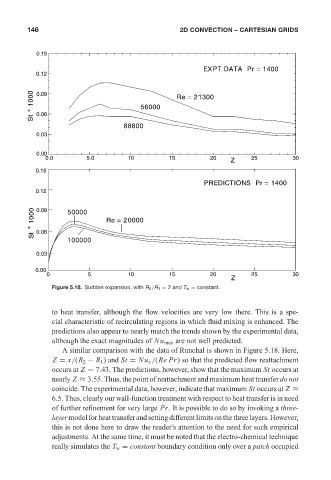
Figure 5.18. Sudden expansion, with R 2 /R 1 = 2 and T w = constant.
to heat transfer, although the flow velocities are very low there. This is a spe-
cial characteristic of recirculating regions in which fluid mixing is enhanced. The
predictions also appear to nearly match the trends shown by the experimental data,
although the exact magnitudes of Nu max are not well predicted.
A similar comparison with the data of Runchal is shown in Figure 5.18. Here,
Z = x/(R 2 − R 1 ) and St = Nu x /(Re Pr) so that the predicted flow reattachment
occurs at Z = 7.43. The predictions, however, show that the maximum St occurs at
nearly Z ≈ 3.55. Thus, the point of reattachment and maximum heat transfer do not
coincide. The experimental data, however, indicate that maximum St occurs at Z ≈
6.5. Thus, clearly our wall-function treatment with respect to heat transfer is in need
of further refinement for very large Pr. It is possible to do so by invoking a three-
layermodelforheattransferandsettingdifferentlimitsonthethreelayers.However,
this is not done here to draw the reader’s attention to the need for such empirical
adjustments. At the same time, it must be noted that the electro-chemical technique
really simulates the T w = constant boundary condition only over a patch occupied