
Page 164 - Introduction to Computational Fluid Dynamics
P. 164
P1: IWV
CB908/Date
0 521 85326 5
0521853265c05
5.6 APPLICATIONS
t/H = 0.3 May 20, 2005 12:28 143
f
1
t/H = 0.05
0.1 t/H = 0.3
2/ 3 t/H = 0.05
Pr
∗
St
0.01
100 1000 Re
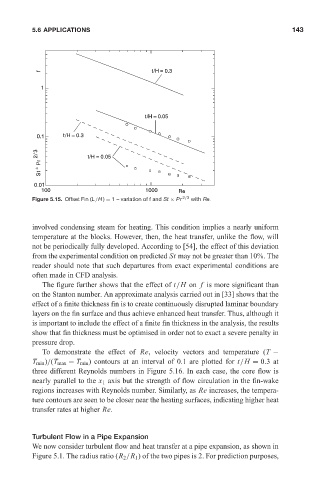
Figure 5.15. Offset Fin (L/H ) = 1 – variation of f and St × Pr 2/3 with Re.
involved condensing steam for heating. This condition implies a nearly uniform
temperature at the blocks. However, then, the heat transfer, unlike the flow, will
not be periodically fully developed. According to [54], the effect of this deviation
from the experimental condition on predicted St may not be greater than 10%. The
reader should note that such departures from exact experimental conditions are
often made in CFD analysis.
The figure further shows that the effect of t/H on f is more significant than
on the Stanton number. An approximate analysis carried out in [33] shows that the
effect of a finite thickness fin is to create continuously disrupted laminar boundary
layers on the fin surface and thus achieve enhanced heat transfer. Thus, although it
is important to include the effect of a finite fin thickness in the analysis, the results
show that fin thickness must be optimised in order not to exact a severe penalty in
pressure drop.
To demonstrate the effect of Re, velocity vectors and temperature (T −
T min )/(T max − T min ) contours at an interval of 0.1 are plotted for t/H = 0.3at
three different Reynolds numbers in Figure 5.16. In each case, the core flow is
nearly parallel to the x 1 axis but the strength of flow circulation in the fin-wake
regions increases with Reynolds number. Similarly, as Re increases, the tempera-
ture contours are seen to be closer near the heating surfaces, indicating higher heat
transfer rates at higher Re.
Turbulent Flow in a Pipe Expansion
We now consider turbulent flow and heat transfer at a pipe expansion, as shown in
Figure 5.1. The radius ratio (R 2 /R 1 ) of the two pipes is 2. For prediction purposes,