Page 193 - System on Package_ Miniaturization of the Entire System
P. 193

Mixed-Signal (SOP) Design   167


                    and C  are the parasitic capacitances to the ground plane, L  and L  are the spreading
                         p2                                           s1     s2
                    inductance of the electrode plates, R  and R  are the series resistance of the electrode
                                                          s2
                                                   s1
                    plates due to conductor loss, and R  is the dielectric loss. The dielectric loss to the
                                                   s1a
                    ground plane has not been included in the equivalent circuit since its effect on the
                    capacitor response is negligible. As an example, for a square capacitor with HL1 =
                    VL1 = 23 mils, LCP thickness = 0.92 mils and the distance to the ground plane of ∼8 mils,
                    the parameters in Figure 4.11 are C = 2.4 pF, C = 497 fF, C = 46 fF, L = 55.9 pH, L =
                                                                                          s2
                                                  s
                                                           p1
                                                                               s1
                                                                      p2
                    56.6 pH, R = 140 mΩ, R = 1 mΩ, and R = 66.7 kΩ. These parameters can be derived
                                         s2
                                                      s1a
                             s1
                    by optimizing the equivalent circuit parameters to fit the frequency response obtained
                    from Sonnet [28] or other electromagnetic simulators.
                       Using the equivalent circuit or the frequency response obtained from an electro-
                    magnetic simulator, the effective capacitance and Q of the capacitor can be obtained as
                                               ⎛      1      ⎞
                                          C eff  =  ⎜   ⎛ 1  ⎞ ⎟  n = 12 ,
                                               ⎜ 2π f Im ag ⎜  ⎟ ⎟                       (4.3)
                                               ⎝        ⎝ Y ⎠ ⎠
                                                          nn
                                                 Imag  Y (  )
                                             Q =        nn    n = , 12                   (4.4)
                                                  Real  Y (  nn )
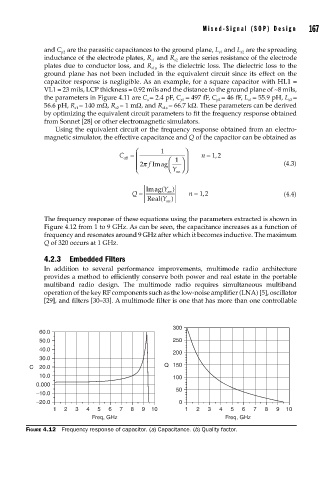
                    The frequency response of these equations using the parameters extracted is shown in
                    Figure 4.12 from 1 to 9 GHz. As can be seen, the capacitance increases as a function of
                    frequency and resonates around 9 GHz after which it becomes inductive. The maximum
                    Q of 320 occurs at 1 GHz.
                    4.2.3 Embedded Filters
                    In addition to several performance improvements, multimode radio architecture
                    provides a method to efficiently conserve both power and real estate in the portable
                    multiband radio design. The multimode radio requires simultaneous multiband
                    operation of the key RF components such as the low-noise amplifier (LNA) [5], oscillator
                    [29], and filters [30–33]. A multimode filter is one that has more than one controllable


                                                         300
                   60.0
                   50.0                                  250
                   40.0
                                                         200
                   30.0
                C  20.0                                Q  150
                   10.0                                  100
                  0.000
                                                          50
                  –10.0
                  –20.0                                    0
                       1  2  3  4   5  6  7  8  9  10        1  2  3   4  5  6  7   8  9  10
                                  Freq, GHz                             Freq, GHz
               FIGURE 4.12  Frequency response of capacitor. (a) Capacitance. (b) Quality factor.
   188   189   190   191   192   193   194   195   196   197   198