
Page 236 - System on Package_ Miniaturization of the Entire System
P. 236
210 Cha pte r F o u r
the design cycle. In this section, the effect of process variations on the electrical
performance is discussed along with a framework for including these variations into
the design process. The goal is to generate designs that are yieldable under the
assumption that catastrophic defects are minimized. Hence, the designs account for
parametric variations due to statistical deviations in the process variables.
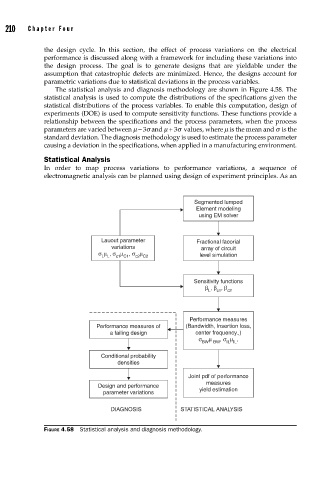
The statistical analysis and diagnosis methodology are shown in Figure 4.58. The
statistical analysis is used to compute the distributions of the specifications given the
statistical distributions of the process variables. To enable this computation, design of
experiments (DOE) is used to compute sensitivity functions. These functions provide a
relationship between the specifications and the process parameters, when the process
parameters are varied between m – 3s and m + 3s values, where m is the mean and s is the
standard deviation. The diagnosis methodology is used to estimate the process parameter
causing a deviation in the specifications, when applied in a manufacturing environment.
Statistical Analysis
In order to map process variations to performance variations, a sequence of
electromagnetic analysis can be planned using design of experiment principles. As an
Segmented lumped
Element modeling
using EM solver
Lauout parameter Fractional facorial
variations array of circuit
σ μ , σ μ , σ μ
L L c1 C1 c2 C2 level simulation
Sensitivity functions
β , β , β
L c1 c2
Performance measures
Performance measures of (Bandwidth, Insertion loss,
a failing design center frequency.,)
σ μ , σ μ ,
BW BW IL IL
Conditional probability
densities
Joint pdf of performance
measures
Design and performance
parameter variations yield estimation
DIAGNOSIS STATISTICAL ANALYSIS
FIGURE 4.58 Statistical analysis and diagnosis methodology.