
Page 238 - System on Package_ Miniaturization of the Entire System
P. 238
212 Cha pte r F o u r
where CC, C_resn1, L1resn_L, and C_match are the component dimensions. Here R 2
2
represents regression coefficients and U is the unit step function. An R value close to
1 indicates good predictive capability. Since the variations of the layout parameters are
independent of each other, the probability density functions (PDFs) of the performance
(for example, BW_1dB) are computed by convolution of the PDFs of the layout
parameters [60g–60h].
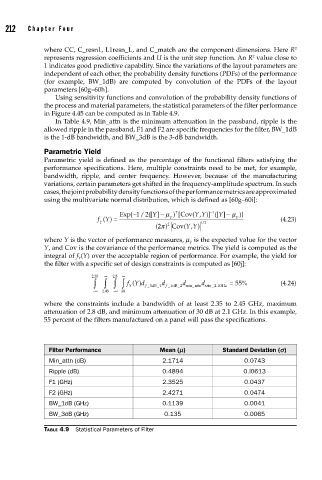
Using sensitivity functions and convolution of the probability density functions of
the process and material parameters, the statistical parameters of the filter performance
in Figure 4.45 can be computed as in Table 4.9.
In Table 4.9, Min_attn is the minimum attenuation in the passband, ripple is the
allowed ripple in the passband, F1 and F2 are specific frequencies for the filter, BW_1dB
is the 1-dB bandwidth, and BW_3dB is the 3-dB bandwidth.
Parametric Yield
Parametric yield is defined as the percentage of the functional filters satisfying the
performance specifications. Here, multiple constraints need to be met, for example,
bandwidth, ripple, and center frequency. However, because of the manufacturing
variations, certain parameters get shifted in the frequency-amplitude spectrum. In such
cases, the joint probability density functions of the performance metrics are approximated
using the multivariate normal distribution, which is defined as [60g–60i]:
T
−1
/ ([
Exp {−12 Y] − μ ) [Cov ( Y Y , )] ([ Y] − μ )} }
fY () = Y Y (4.23)
Y 12
/
(2π ) Cov YY
2
( , )
where Y is the vector of performance measures, m is the expected value for the vector
Y
Y, and Cov is the covariance of the performance metrics. The yield is computed as the
integral of f (Y) over the acceptable region of performance. For example, the yield for
Y
the filter with a specific set of design constraints is computed as [60j]:
.
235 ∞ 28 . ∞
∫∫ ∫ ∫ fY f _ 1dB _ 1 d f _ 1dB 2 min_attn attn _ 2 1GHz = 55% (4.24)
d
()d
d
_
Y
2
.
−∞ 245 −∞ 30
.
where the constraints include a bandwidth of at least 2.35 to 2.45 GHz, maximum
attenuation of 2.8 dB, and minimum attenuation of 30 dB at 2.1 GHz. In this example,
55 percent of the filters manufactured on a panel will pass the specifications.
Filter Performance Mean (m) Standard Deviation (s)
Min_attn (dB) 2.1714 0.0743
Ripple (dB) 0.4894 0.l0613
F1 (GHz) 2.3525 0.0437
F2 (GHz) 2.4271 0.0474
BW_1dB (GHz) 0.1139 0.0041
BW_3dB (GHz) 0.135 0.0065
TABLE 4.9 Statistical Parameters of Filter