
Page 100 - Materials Chemistry, Second Edition
P. 100
82 LIFE CYCLE ASSESSMENT HANDBOOK
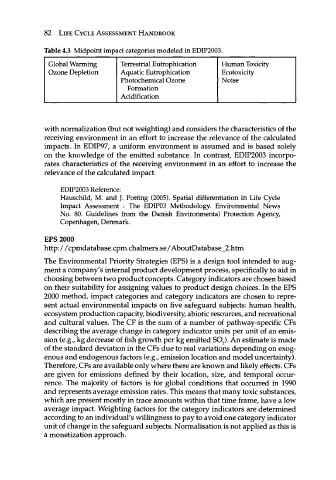
Table 4.3 Midpoint impact categories modeled in EDIP2003.
Global Warming Terrestrial Eutrophication Human Toxicity
Ozone Depletion Aquatic Eutrophication Ecotoxicity
Photochemical Ozone Noise
Formation
Acidification
with normalization (but not weighting) and considers the characteristics of the
receiving environment in an effort to increase the relevance of the calculated
impacts. In EDIP97, a uniform environment is assumed and is based solely
on the knowledge of the emitted substance. In contrast, EDIP2003 incorpo-
rates characteristics of the receiving environment in an effort to increase the
relevance of the calculated impact.
EDIP2003 Reference:
Hauschild, M. and J. Potting (2005). Spatial differentiation in Life Cycle
Impact Assessment : The EDIP03 Methodology. Environmental News
No. 80. Guidelines from the Danish Environmental Protection Agency,
Copenhagen, Denmark.
EPS 2000
http: / / cpmdatabase.cpm.chalmers.se/ AboutDatabase_2.htm
The Environmental Priority Strategies (EPS) is a design tool intended to aug-
ment a company's internal product development process, specifically to aid in
choosing between two product concepts. Category indicators are chosen based
on their suitability for assigning values to product design choices. In the EPS
2000 method, impact categories and category indicators are chosen to repre-
sent actual environmental impacts on five safeguard subjects: human health,
ecosystem production capacity, biodiversity, abiotic resources, and recreational
and cultural values. The CF is the sum of a number of pathway-specific CFs
describing the average change in category indicator units per unit of an emis-
sion (e.g., kg decrease of fish growth per kg emitted S0 2 ). An estimate is made
of the standard deviation in the CFs due to real variations depending on exog-
enous and endogenous factors (e.g., emission location and model uncertainty).
Therefore, CFs are available only where there are known and likely effects. CFs
are given for emissions defined by their location, size, and temporal occur-
rence. The majority of factors is for global conditions that occurred in 1990
and represents average emission rates. This means that many toxic substances,
which are present mostly in trace amounts within that time frame, have a low
average impact. Weighting factors for the category indicators are determined
according to an individual's willingness to pay to avoid one category indicator
unit of change in the safeguard subjects. Normalisation is not applied as this is
a monetization approach.